Campbell closes 20 sales at a $1.72M median — but a $622K townhouse beat its list by 24 percent
The month at a glance
| Metric | August 2026 |
|---|---|
| Closings | 20 |
| Median sale price | $1,717,500 |
| Median price per sq ft | $985 |
| Total volume | $34,280,523 |
| Price range | $622,000 – $2,725,000 |
| Median lot size (where recorded) | 6,400 sq ft |
| Active listings (end of period) | 97 |
| Pending (end of period) | 17 |
| Median active list price | $1,700,000 |
Twenty closings across all segments produced a median sale price of $1,717,500 and a median $985 per square foot. Both figures sit in the middle of the six-month range rather than at either extreme — August did not set a high-water mark, nor did it break anything on the downside. What the headline numbers conceal is the distribution of outcomes: eleven of the twenty sales closed above asking, two landed exactly at list, and seven settled below. The spread from the month's biggest premium (+24.4 percent at 5020 Pine Tree Terrace) to its deepest discount (−6.6 percent, derived from the widest under-list close) is 31 percentage points. That is not a market speaking with one voice.
Total volume of $34.3 million on 20 closings compares to a mean sale price of roughly $1.71 million, which the pair of $2.6M-plus closes pulled above the median. The 97 active listings sitting unsold at month's end, priced at a median of $1.7 million, represent close to five months of supply at August's pace — more than enough to give buyers options, though the 17 pending deals suggest demand has not gone quiet. Year-over-year comparison is not available; no confirmed closings were recorded for August of the prior year.
Every sale this month
| Address | Segment | Beds | Sq Ft | List Price | Sale Price | % of List |
|---|---|---|---|---|---|---|
| 1324 Bent Drive | Single Family | 3 | 2,225 | $2,725,000 | $2,725,000 | 100.0% |
| 499 W Latimer Ave #02-18 | Single Family | 4 | 2,578 | $2,596,398 | $2,622,148 | 101.0% |
| 4765 Del Loma Court | Single Family | 4 | 1,870 | $2,398,000 | $2,620,000 | 109.3% |
| 2114 La Miel Way | Single Family | 3 | 1,586 | $1,998,000 | $2,180,000 | 109.1% |
| 1133 Erin Way | Single Family | 3 | 1,975 | $1,799,888 | $2,110,000 | 117.2% |
| 1235 Shamrock Drive | Single Family | 4 | 2,120 | $1,899,000 | $2,020,000 | 106.4% |
| 2293 Middletown Drive | Single Family | 4 | 1,512 | $1,899,000 | $1,990,000 | 104.8% |
| 2261 Central Park Drive | Single Family | 4 | 1,687 | $1,848,000 | $1,965,000 | 106.3% |
| 1331 Patio Drive | Single Family | 3 | 1,752 | $1,898,000 | $1,825,000 | 96.2% |
| 188 W Rincon Avenue | Single Family | 4 | 1,902 | $1,788,000 | $1,785,000 | 99.8% |
| 1341 Parsons Avenue | Single Family | 4 | 1,318 | $1,649,000 | $1,650,000 | 100.1% |
| 816 Mary Court | Single Family | 3 | 1,108 | $1,649,000 | $1,585,000 | 96.1% |
| 1071 Monica Lane | Single Family | 5 | 2,366 | $1,515,000 | $1,515,000 | 100.0% |
| 221 W Rincon Avenue | Townhouse | 3 | 1,975 | $1,499,000 | $1,400,000 | 93.4% |
| 865 Apricot Avenue | Townhouse | 3 | 1,679 | $1,275,000 | $1,342,000 | 105.3% |
| 208 Kamson Way | Single Family | 3 | 1,394 | $1,300,000 | $1,250,000 | 96.2% |
| 182 Redding Road | Townhouse | 3 | 1,308 | $1,180,000 | $1,237,000 | 104.8% |
| 21 N 2nd Street #407 | Condominium | 2 | 1,289 | $1,095,000 | $1,077,375 | 98.4% |
| 909 Apricot Avenue #C | Condominium | 2 | 1,187 | $779,000 | $760,000 | 97.6% |
| 5020 Pine Tree Terrace | Townhouse | 2 | 920 | $499,990 | $622,000 | 124.4% |
Four closings explain most of what August was doing beneath the surface.
1133 Erin Way finished at $2,110,000 against a $1,799,888 list — a $310,000 premium, or 117.2 percent of asking, on a 1,975-square-foot 1947 ranch on a 9,234-square-foot lot. That is the second-largest percentage premium in the month, achieved by a house that, on paper, is neither the largest nor the newest. The lot and the location did the work.
4765 Del Loma Court printed at $2,620,000, or 109.3 percent of a $2,398,000 ask, on just 1,870 square feet — pushing the price per square foot to $1,401, the highest of any sale this month. A 1963 build on a 6,750-square-foot lot in the $2M-plus tier still attracted a $222,000 overbid. Premium buyers were not waiting.
5020 Pine Tree Terrace is the month's outlier in the other direction: a 1973-built two-bedroom, 920-square-foot townhouse listed at $499,990 that closed at $622,000 — 124.4 percent of asking, the largest premium by percentage. That is a $122,010 overbid on the month's lowest-priced listing. Whatever the pricing strategy was, it triggered a bidding response that no other listing managed to match in percentage terms. The entry-level is not dead.
2261 Central Park Drive sat on the market for 88 days before closing at $1,965,000, or 106.3 percent of its $1,848,000 list (DOM drawn from one of five closings for which that figure was recorded). It got there eventually, and the final number was not punishing — but 88 days is a different kind of buyer conversation than the six-day close at 1235 Shamrock Drive.
Where the market split
| Segment | Sales | Sale Range | Median Price | Median $/Sq Ft | Over List |
|---|---|---|---|---|---|
| Single Family | 14 | $1,250,000 – $2,725,000 | $1,977,500 | $1,117 | 8 of 14 |
| Townhouse | 4 | $622,000 – $1,400,000 | $1,289,500 | $754 | 3 of 4 |
| Condominium | 2 | $760,000 – $1,077,375 | n/a — range only | $738 | 0 of 2 |
The condominium segment produced only two closings, which is not enough to support a meaningful median. The range — $760,000 to $1,077,375 — is given instead, and both sales closed below list (97.6 and 98.4 percent respectively). That is a small sample, but it is a consistent one: neither condo buyer paid a premium.
Single-family homes carried the month. Fourteen of the twenty closings were detached houses, and their median of $1,977,500 (across 14 sales) pulled the overall median toward the upper half of the $1.5M–$2M price band. Eight of those 14 closed over asking — a 57 percent strike rate for overbids within the segment alone. The median price per square foot of $1,117 for single-family homes is substantially above the $754 recorded for townhouses, a gap that reflects both the land premium and the buyer competition that detached product continues to attract.
Townhouses turned in an interesting internal split. Three of four closed over list, and the fourth — 221 W Rincon Avenue — gave back 6.6 percent of its $1,499,000 ask, settling at $1,400,000. Remove that one outlier and the townhouse segment looks competitive. Include it, and the median of $1,289,500 (across four sales) is still $410,000 below the single-family median.
| Price Band | Sales | Median Price | Median $/Sq Ft |
|---|---|---|---|
| Under $1M | 2 | $691,000 | $658 |
| $1M – $1.5M | 5 | $1,250,000 | $836 |
| $1.5M – $2M | 7 | $1,785,000 | $1,165 |
| $2M – $3M | 6 | $2,400,000 | $1,147 |
The price-band table reveals something the segment breakdown does not: the $1.5M–$2M band, with seven closings, was the most active tier of the month, and its median price per square foot of $1,165 actually exceeds that of the $2M–$3M band at $1,147. Buyers spending between $1.5M and $2M paid the highest density price in August. That is a function of the smaller-footprint, well-located houses that clustered in this band — including the sub-1,600-square-foot ranches on Del Loma and La Miel that overbid past $2M and therefore graduated into the top tier, leaving the $1.5M–$2M band with somewhat tighter inventory of mid-size homes where demand per square foot ran hot.
The under-$1M band held two sales — both condominiums — with a median of $691,000. Activity below seven figures is thin. Nothing in the $1M–$1.5M band closed in the single-family segment; all five sales there were condominiums, townhouses, or the one single-family outlier at 208 Kamson Way.
Against asking
| Metric | Value |
|---|---|
| Over list | 11 of 20 (55%) |
| At list | 2 of 20 (10%) |
| Under list | 7 of 20 (35%) |
| Median % of list | 100.5% |
| Largest premium | +24.4% (5020 Pine Tree Terrace) |
| Largest discount | −6.6% (221 W Rincon Avenue) |
A median of 100.5 percent of list across all 20 closings gives the impression of a market in precise equilibrium. It is not. The 31-percentage-point spread from the largest premium to the deepest discount describes a market where pricing discipline varied sharply by property, not one where sellers and buyers were consistently reading from the same sheet.
The 55 percent over-list rate is the number that matters more than the median. More than half of August's sellers received more than they asked, which means the most common outcome was a competition — not a negotiation. The seven under-list closings, however, show that mispriced or condition-challenged listings do not get a free pass. The two properties that closed below 97 percent of list — 221 W Rincon Avenue (93.4%) and 1331 Patio Drive (96.2%) — shared neither a segment nor a price point. The discount was a function of the individual listing, not a category.
The 24.4 percent premium at 5020 Pine Tree Terrace deserves its own sentence: a $122,010 overbid on a $499,990 list means the final price was effectively set by the buyers, not the seller. Whether that reflects a deliberately low anchor price or genuine market scarcity for a two-bedroom under $700K in Campbell, the result is the same.
Six months in context
| Month | Closings | Median Price | Median $/Sq Ft |
|---|---|---|---|
| March 2026 | 27 | $1,835,000 | $1,052 |
| April 2026 | 29 | $2,200,000 | $1,123 |
| May 2026 | 25 | $1,700,000 | $973 |
| June 2026 | 24 | $1,690,000 | $965 |
| July 2026 | 27 | $2,100,000 | $1,207 |
| August 2026 | 20 | $1,717,500 | $985 |
The six-month trend does not move in one direction. It oscillates. April's $2,200,000 median was not sustained into May; July's $2,100,000 and $1,207 per square foot — the highest price-per-foot of the window — was not sustained into August. Both of those peak months coincided with higher closing counts (29 and 27, respectively), which suggests that when more listings close in a given month, the mix shifts toward the higher-priced single-family product that had been in contract the previous month. August's 20 closings — the lowest of the six-month stretch — reflect a thinner close count rather than a broad repricing.
The price-per-square-foot range across the six months spans $965 (June) to $1,207 (July), a 25 percent swing, which is wide for a 180-day window. The more useful observation is where the floor has been: no month in this run has posted a median below $1,690,000, and four of the six months have landed between $1,700,000 and $1,835,000 when excluding the April and July spikes. August's $1,717,500 fits that pattern.
Closing volume has contracted from the spring peak. March through April averaged 28 closings per month. May through August averaged 24. Whether that reflects seasonal pace, tighter listings entering contract, or buyer hesitation is not determinable from closing data alone.
What it means
For sellers: The 55 percent over-list rate is encouraging, but it is not evenly distributed. The sales that produced overbids were — almost without exception — detached single-family homes, correctly priced relative to condition, or listed well below where the market ultimately cleared. The two sellers who listed at or above $1.6M and closed below asking did not recover their full ask. Pricing to the market rather than above it produced faster closings and, in several cases, competitive offers. Sitting on the market long enough to need a price reduction is not a theoretical risk in this environment — 2261 Central Park Drive closed at 106 percent of list after 88 days on market, but that was not the typical experience.
For buyers: Eleven of twenty sellers in August received more than asking. If the property is in the $1.5M–$2M single-family band — the busiest and most per-square-foot expensive tier of the month — plan for competition and price accordingly. Below $1M, there were only two sales, both condominiums, both slightly below list; the entry tier is thin but not frenzied on the seller's side. The 97 active listings at a median of $1.7M mean there is selection, but pending count of 17 means the pipeline is moving. Waiting for a broader softening is not a strategy the August data supports, nor contradicts — the six-month trend does not move steadily in either direction.
For owners not transacting: The range of outcomes this month — from a house selling for $622,000 to one selling for $2,725,000 within the same city limits — is a reminder that Campbell's value proposition is not monolithic. The $985 median price per square foot across all 20 closings captures single-family ranches, attached townhouses, and downtown condominiums in a single number. That number is less useful for estimating the value of any specific property than it might appear. The segment-level figures — $1,117 for single family, $754 for townhouses — are more relevant starting points, and even those are summaries of a wide spread.
Tim McMullen · Tim McMullen, Broker · CA DRE #02016832
[email protected] · (415) 691-9272
More from Campbell
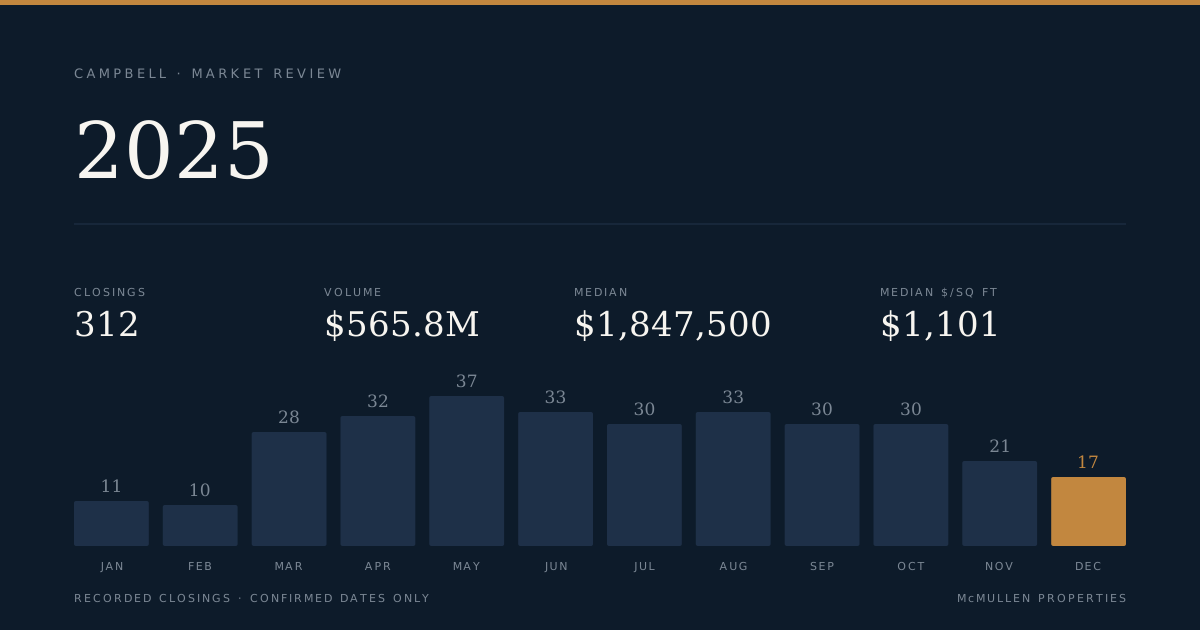
Campbell Records 312 Closings and $565.8M in Volume for 2025, With a $1.45M Spread Between Segments
All 312 closed sales across single-family, townhouse, and condominium segments are reflected in this report. The overall median landed at $1,847,500, while the single-family segment sat $1,443,056 above the condominium median.
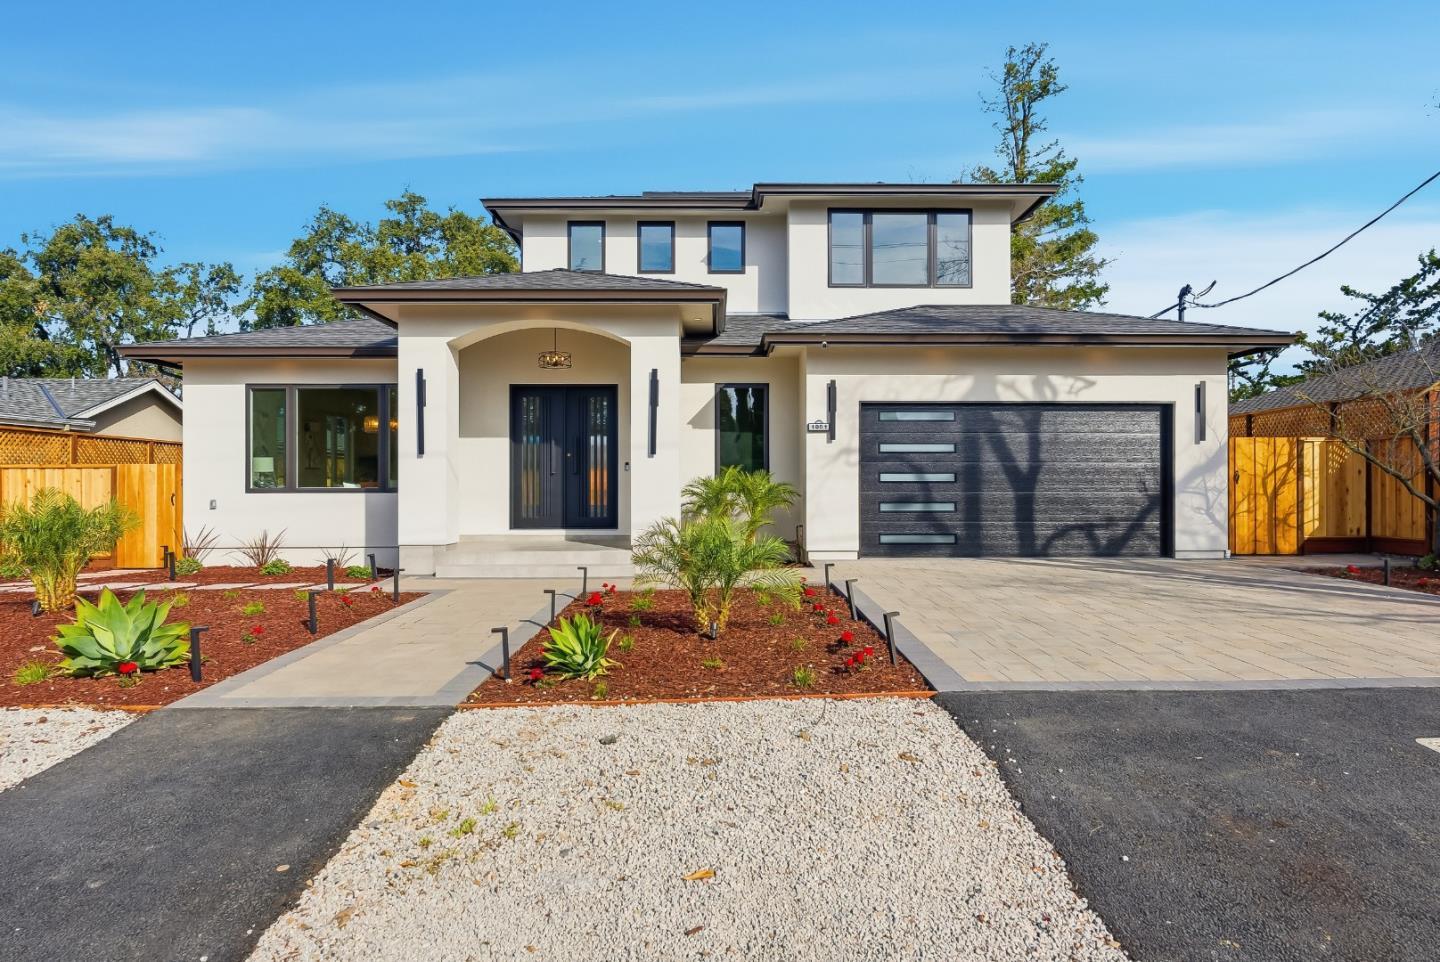
Campbell Q1 2026: 42 Closings, $76M in Volume, and a Median That Fell $408K in Three Months
Forty-two transactions closed across Campbell in Q1 2026, totaling $76.1 million. The overall median price began the quarter at $1,978,888 in January and ended at $1,570,000 in March — a 21 percent slide driven by a shift in the mix of what closed each month.
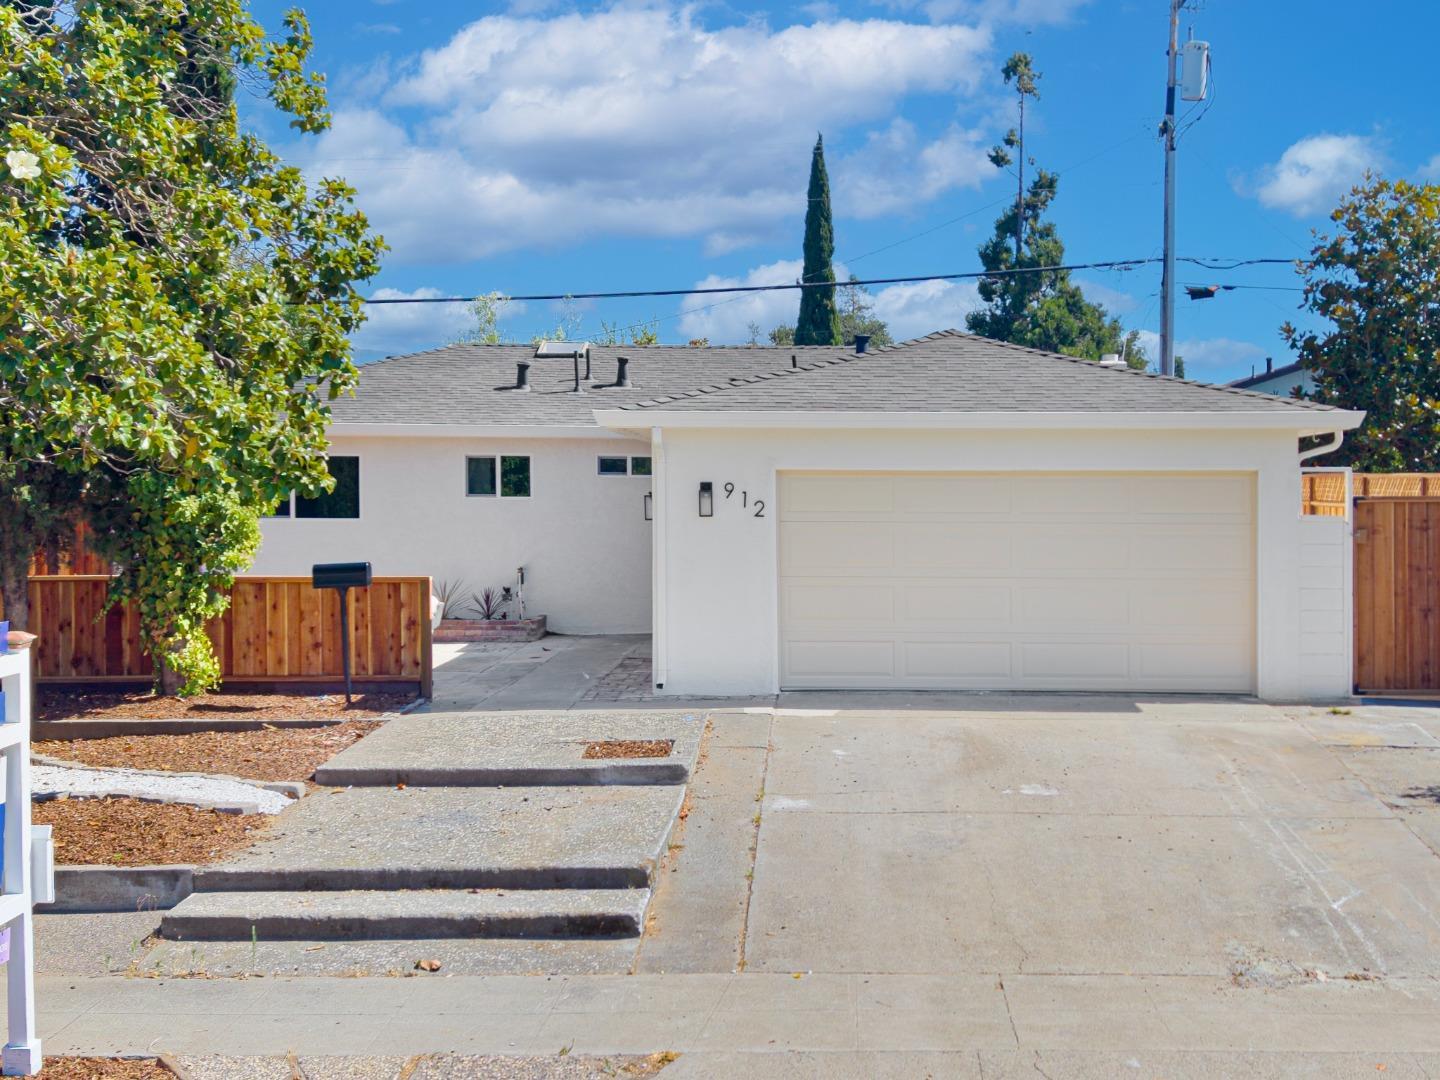
Back on the market 8 months after it last sold, 912 Connie Drive is asking $275,000 more
912 Connie Drive recorded as sold in January 2026 for $1,560,000. It hit the market again in August asking $1,835,000. The gap is $275,000 in 7.5 months.