Campbell Q1 2026: 42 Closings, $76M in Volume, and a Median That Fell $408K in Three Months
The period at a glance
The quarter's most striking fact sits in the month-by-month data: the period-wide median price of $1,799,000 (across 42 closings) masks a $408,888 drop from January's median of $1,978,888 to March's $1,570,000. That movement is not a single dramatic event — it is a gradual reweighting of what was reaching the closing table as the quarter progressed, with more townhouses and lower-price-band single-families closing in February and March. List prices are not available in the source data for this period.
| Metric | Q1 2026 |
|---|---|
| Period | Jan 1 – Mar 31, 2026 |
| Total closings | 42 |
| Total volume | $76,092,887 |
| Median sale price | $1,799,000 |
| Median price per sq ft | $1,081 |
| Median square footage | 1,455 |
| Median lot size | 6,700 sq ft |
| Price range | $432,000 – $4,560,000 |
| Median days on market | 11 (reported on all 42 closings) |
| Longest DOM | 154 days |
The overall median of $1,799,000 is pulled upward by the single-family segment, which contributed 27 of the 42 closings and carried a segment median of $2,100,000 at $1,395 per square foot. Remove that segment and the picture changes substantially: condominiums (8 closings) posted a segment median of $609,500, and townhouses (7 closings) came in at $1,215,000. The spread between the single-family median and the condominium median — $1,490,500 — is the widest gap across the three segments and frames the choices available to buyers at different price points.
Days on market were recorded for all 42 closings, so the speed figures carry the full weight of the period. The median of 11 days sits between two poles: 14 closings completed in under 7 days and 6 closings required more than 60 days, with the longest running 154 days at 21 N 2nd Street, #303.
The sales
The table below shows all 42 closings ranked by sale price. Because the roster covers the entire 42-closing period, it is complete.
| Address | Segment | Beds | Sq Ft | $/Sq Ft | Sale Price | DOM | Closed |
|---|---|---|---|---|---|---|---|
| 1001 Audrey Avenue | Single Family | 6 | 4,018 | $1,134.89 | $4,560,000 | 19 | Mar 10 |
| 615 Chapman Drive | Single Family | 5 | 3,370 | $1,207.72 | $4,070,000 | 94 | Jan 9 |
| 504 Century Drive | Single Family | 4 | 1,856 | $1,751.08 | $3,250,000 | 8 | Feb 20 |
| 371 N Milton Avenue | Single Family | 4 | 2,129 | $1,503.05 | $3,200,000 | 9 | Feb 10 |
| 665 Hawthorne Avenue | Single Family | 5 | 3,117 | $962.46 | $2,999,999 | 92 | Feb 4 |
| 295 Beverly Court | Single Family | 4 | 1,946 | $1,438.85 | $2,800,000 | 11 | Mar 27 |
| 1285 Capri Drive | Single Family | 2 | 1,100 | $2,527.27 | $2,780,000 | 0 | Mar 31 |
| 1100 Steinway Avenue | Single Family | 4 | 1,915 | $1,420.37 | $2,720,000 | 6 | Jan 21 |
| 605 Corliss Way | Single Family | 5 | 2,025 | $1,110.12 | $2,248,000 | 31 | Jan 20 |
| 3834 Abbey Court | Single Family | 4 | 1,892 | $1,162.79 | $2,200,000 | 0 | Mar 2 |
| 333 W Rincon Avenue | Single Family | 4 | 2,027 | $1,050.81 | $2,130,000 | 6 | Feb 9 |
| 195 Sunnyside Avenue | Single Family | 4 | 1,872 | $1,127.14 | $2,110,000 | 12 | Jan 6 |
| 816 Marilyn Drive | Single Family | 3 | 1,166 | $1,801.89 | $2,101,000 | 6 | Jan 13 |
| 1460 Inskip Drive | Single Family | 3 | 1,204 | $1,744.19 | $2,100,000 | 3 | Jan 4 |
| 1094 Denver Drive | Single Family | 3 | 1,144 | $1,748.25 | $2,000,000 | 4 | Feb 2 |
| 2258 Highland Park Lane | Single Family | 3 | 1,295 | $1,528.10 | $1,978,888 | 6 | Jan 17 |
| 824 Jones Way | Single Family | 3 | 1,342 | $1,430.70 | $1,920,000 | 9 | Jan 11 |
| 1040 Linda Drive | Single Family | 4 | 1,191 | $1,574.31 | $1,875,000 | 9 | Feb 19 |
| 1054 Steinway Avenue | Single Family | 3 | 1,326 | $1,395.17 | $1,850,000 | 2 | Mar 6 |
| 908 Marilyn Drive | Single Family | 4 | 1,744 | $1,052.18 | $1,835,000 | 83 | Mar 13 |
| 271 N Central Avenue | Single Family | 3 | 1,056 | $1,712.12 | $1,808,000 | 5 | Feb 18 |
| 2122 Vizcaya Way | Townhouse | 3 | 2,656 | $673.95 | $1,790,000 | 7 | Mar 4 |
| 68 Page Street | Single Family | 3 | 1,471 | $1,162.47 | $1,710,000 | 11 | Feb 19 |
| 733 S San Tomas Aquino Road | Single Family | 2 | 1,003 | $1,695.91 | $1,701,000 | 18 | Feb 19 |
| 238 Railway Avenue | Townhouse | 3 | 1,868 | $845.82 | $1,580,000 | 67 | Jan 25 |
| 206 Sunnyside Avenue | Single Family | 4 | 1,864 | $842.27 | $1,570,000 | 53 | Mar 27 |
| 912 Connie Drive | Single Family | 4 | 1,189 | $1,312.03 | $1,560,000 | 0 | Jan 30 |
| 1036 Smith Avenue | Single Family | 4 | 1,695 | $914.45 | $1,550,000 | 0 | Jan 16 |
| 402 Union Avenue, #A | Townhouse | 3 | 1,683 | $849.67 | $1,430,000 | 9 | Mar 23 |
| 422 W Sunnyoaks Ave | Single Family | 4 | 1,766 | $781.43 | $1,380,000 | 15 | Mar 6 |
| 722 Duncanville Court | Townhouse | 2 | 1,727 | $703.53 | $1,215,000 | 14 | Mar 11 |
| 540 Valley Forge Way | Townhouse | 3 | 1,242 | $864.73 | $1,074,000 | 13 | Jan 16 |
| 833 S San Tomas Aquino, #L | Townhouse | 2 | 1,467 | $674.85 | $990,000 | 53 | Feb 20 |
| 87 Salice Way | Townhouse | 2 | 1,151 | $814.94 | $938,000 | 18 | Mar 28 |
| 47 Dot Avenue, #D | Condominium | 2 | 1,442 | $599.86 | $865,000 | 8 | Mar 13 |
| 21 N 2nd Street, #303 | Condominium | 1 | 873 | $833.91 | $728,000 | 154 | Feb 5 |
| 383 E Latimer Avenue, #2 | Condominium | 2 | 903 | $747.51 | $675,000 | 5 | Feb 6 |
| 331 N 1st Street, #3 | Condominium | 2 | 903 | $696.57 | $629,000 | 28 | Mar 17 |
| 848 Apricot Avenue, #B | Condominium | 1 | 887 | $665.16 | $590,000 | 28 | Mar 27 |
| 390 N 1st Street, #2 | Condominium | 2 | 903 | $636.77 | $575,000 | 124 | Jan 9 |
| [2 closings below roster threshold] | — | — | — | — | — | — | — |
The data source notes two additional closings below the top-40 price threshold; those transactions are reflected in segment and period totals but do not appear in the roster.
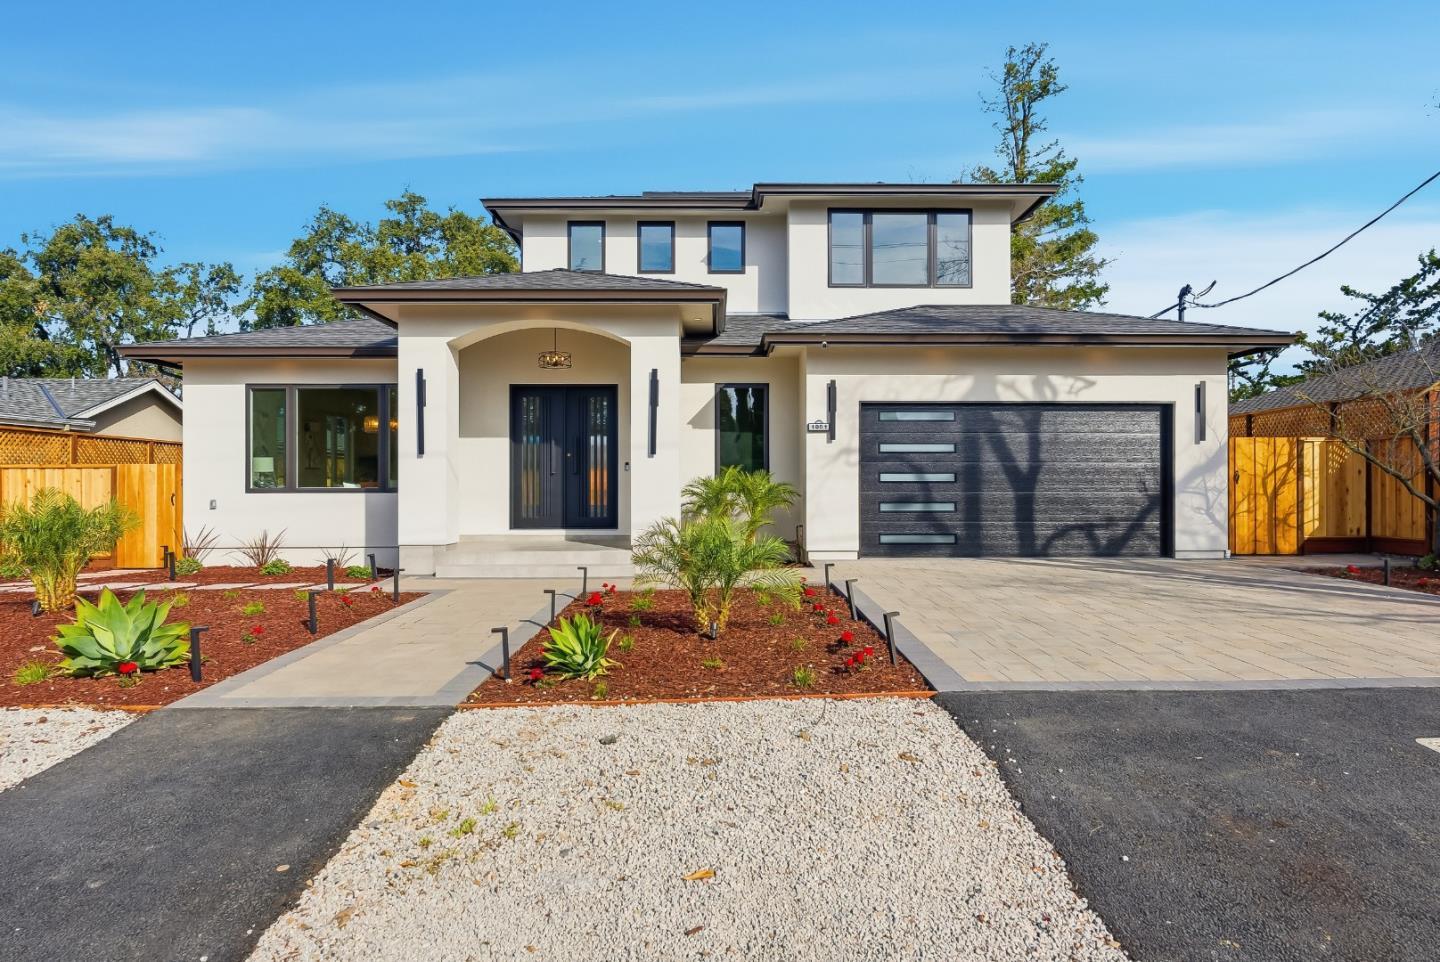
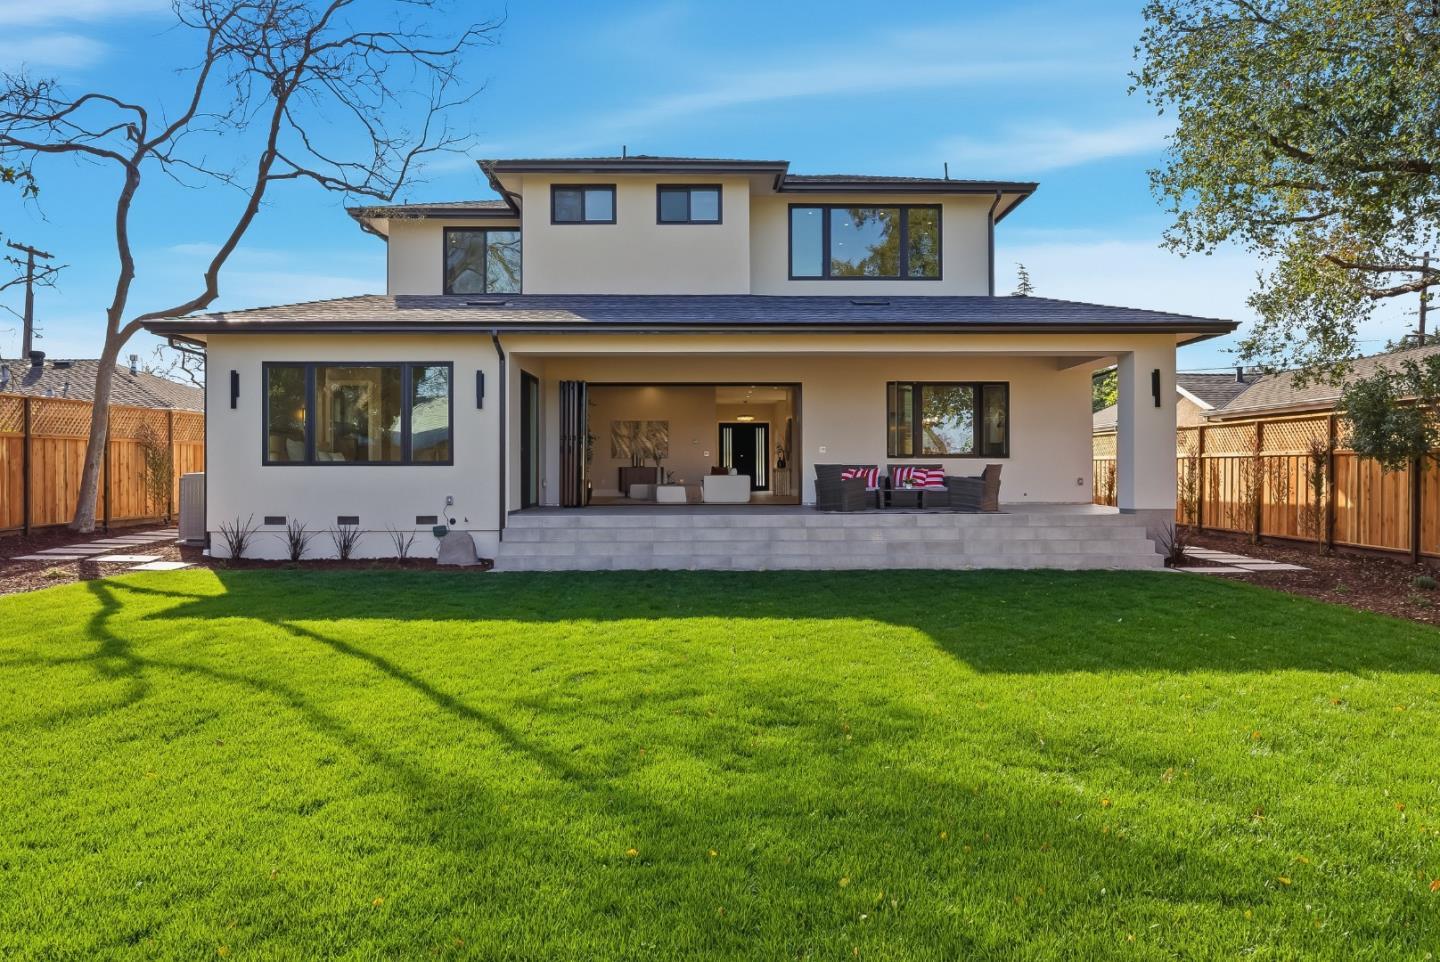
Four transactions anchor the quarter's narrative. At the top, 1001 Audrey Avenue — a 6-bedroom, 4,018-square-foot new construction on a 10,950-square-foot lot — closed at $4,560,000 on March 10 after 19 days, posting $1,134.89 per square foot. At $4,070,000, 615 Chapman Drive (also new construction, 3,370 sq ft) was the second-highest close but required 94 days to get there — the longest run of any single-family sale in the roster and a reminder that new construction at this scale does not necessarily move on the same clock as established stock.
The most provocative price-per-square-foot figure in the entire period belongs to 1285 Capri Drive: a 2-bedroom, 1,100-square-foot 1947 home on a 12,960-square-foot lot that closed at $2,780,000 — $2,527.27 per square foot — on the last day of the quarter with zero days on market. The combination of lot size, vintage, and near-instant close at that per-square-foot figure stands well apart from anything else in the record. At the other end of the timeline, 21 N 2nd Street, #303, a one-bedroom downtown condominium built in 2008, spent 154 days in the market before closing at $728,000 — the longest DOM of the quarter by a margin of 30 days.
Where the market split
By segment
| Segment | Closings | Median Price | Median $/Sq Ft | Median Sq Ft | Price Range |
|---|---|---|---|---|---|
| Single Family | 27 | $2,100,000 | $1,395 | 1,744 | $1,380,000 – $4,560,000 |
| Townhouse | 7 | $1,215,000 | $815 | 1,683 | $938,000 – $1,790,000 |
| Condominium | 8 | $609,500 | $675 | 895 | $432,000 – $865,000 |
Segment medians are based on the closing counts above; all three segments clear the three-sale minimum for a median to be reported.
The single-family segment (27 closings, median $2,100,000 at $1,395/sq ft) and the condominium segment (8 closings, median $609,500 at $675/sq ft) are separated by a 3.4-to-1 ratio on price and a 2.1-to-1 ratio on price per square foot. That per-square-foot gap — $720 — is not simply about size. The median condominium in this period was 895 square feet; the median single-family home was 1,744 square feet. But even adjusting for size, the condominium segment's $675/sq ft sits far below the townhouse segment's $815/sq ft, which in turn sits far below single-family.
The townhouse segment's 7 closings span a $852,000 price range ($938,000 to $1,790,000), which is wide relative to its sample. The top end of that range — 2122 Vizcaya Way at $1,790,000 for 2,656 square feet — closed in 7 days, while 238 Railway Avenue at $1,580,000 for 1,868 square feet required 67 days. The townhouse segment contains no straightforward median story; the range across 7 closings is doing more work than the midpoint.
By price band
| Price Band | Closings | Median $/Sq Ft |
|---|---|---|
| Under $1M | 10 | $680 |
| $1M – $1.5M | 4 | $816 |
| $1.5M – $2M | 13 | $1,312 |
| $2M – $3M | 11 | $1,420 |
| $3M – $5M | 4 | $1,355 |
The $1.5M–$2M band was the most active of the quarter with 13 closings, and it posted a median of $1,312 per square foot — a substantial step up from the $816/sq ft in the $1M–$1.5M band just below it. That $496/sq ft jump between adjacent bands is the largest in the table and reflects the transition from townhouse-and-smaller-single-family territory into more typical Campbell single-family stock.
The $3M–$5M band (4 closings, median $1,355/sq ft) sits slightly below the $2M–$3M band (11 closings, median $1,420/sq ft) on a per-square-foot basis. That inversion is partly a size effect: the four closings above $3M include two large new-construction homes — 4,018 and 3,370 square feet respectively — where the per-square-foot rate is diluted by scale even as the absolute price is highest. The $1M–$1.5M band had only 4 closings; the median there is reliable but should be read in the context of a thin sample.
Across the quarter
| Month | Closings | Median Price | Median $/Sq Ft |
|---|---|---|---|
| January 2026 | 13 | $1,978,888 | $1,208 |
| February 2026 | 14 | $1,759,000 | $1,107 |
| March 2026 | 15 | $1,570,000 | $842 |
Every metric moved in one direction across the three months: closings rose by two each month while both the median price and median per-square-foot declined continuously. January's median of $1,978,888 at $1,208/sq ft fell to $1,759,000 and $1,107/sq ft in February, then to $1,570,000 and $842/sq ft in March.
The per-square-foot decline is steeper in percentage terms than the price decline. From January to March, the median price fell 21 percent; the median per-square-foot fell 30 percent. That divergence points to a mix shift toward larger-footprint, lower-ppsf properties in March — townhouses and larger single-family homes — rather than a uniform repricing of identical stock. March's 15 closings included three of the seven townhouse closings for the quarter, all of which carried per-square-foot rates well below the single-family norm.
The 6 closings that required more than 60 days — Chapman Drive (94), Hawthorne Avenue (92), Marilyn Drive at 908 (83), Railway Avenue (67), the downtown condominium at 21 N 2nd Street (154), and 390 N 1st Street (124) — are scattered across January, February, and March, and across segments. There is no single month where the slow-moving stock concentrated.
What it means
For sellers: The 42-closing quarter moved $76.1 million in total volume at a period-wide median of $1,799,000. The median days on market across all 42 closings was 11 days, and 14 of those closings completed in under 7 days. Six closings required more than 60 days, and in each case the extended timeline was associated with either a price point above $2.5M (where the two new-construction large-format homes sat), a downtown condominium, or a townhouse with a specific locational or condition profile. The record does not show a uniform experience across all property types.
For buyers: The quarter contained 10 closings under $1 million, all of them condominiums or smaller townhouses, at a median of $680 per square foot. Thirteen closings fell in the $1.5M–$2M band — the busiest band of the quarter — at a median of $1,312 per square foot. The gap between what closed quickly (median 11 days, 14 closings under 7 days) and what sat (6 closings over 60 days) cuts across price points and segments; the 154-day condominium and the 94-day new-construction single-family occupied opposite ends of the price spectrum.
For owners not transacting: The quarter's $76.1 million in volume across 42 closings represents the observable transaction record for Campbell through March 31, 2026. The month-by-month median moved from $1,978,888 in January to $1,570,000 in March, a shift driven by the composition of what closed rather than by any single identifiable event. That distinction matters when reading a single month's figures in isolation.
Tim McMullen · Tim McMullen, Broker · CA DRE #02016832
[email protected] · (415) 691-9272
More from Campbell
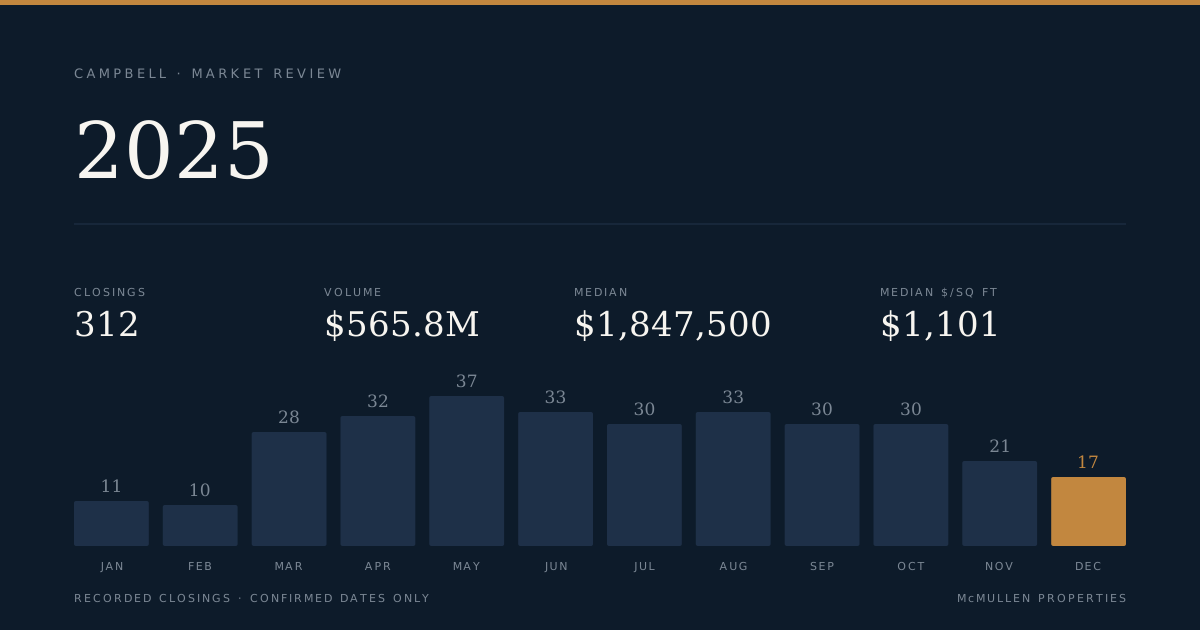
Campbell Records 312 Closings and $565.8M in Volume for 2025, With a $1.45M Spread Between Segments
All 312 closed sales across single-family, townhouse, and condominium segments are reflected in this report. The overall median landed at $1,847,500, while the single-family segment sat $1,443,056 above the condominium median.
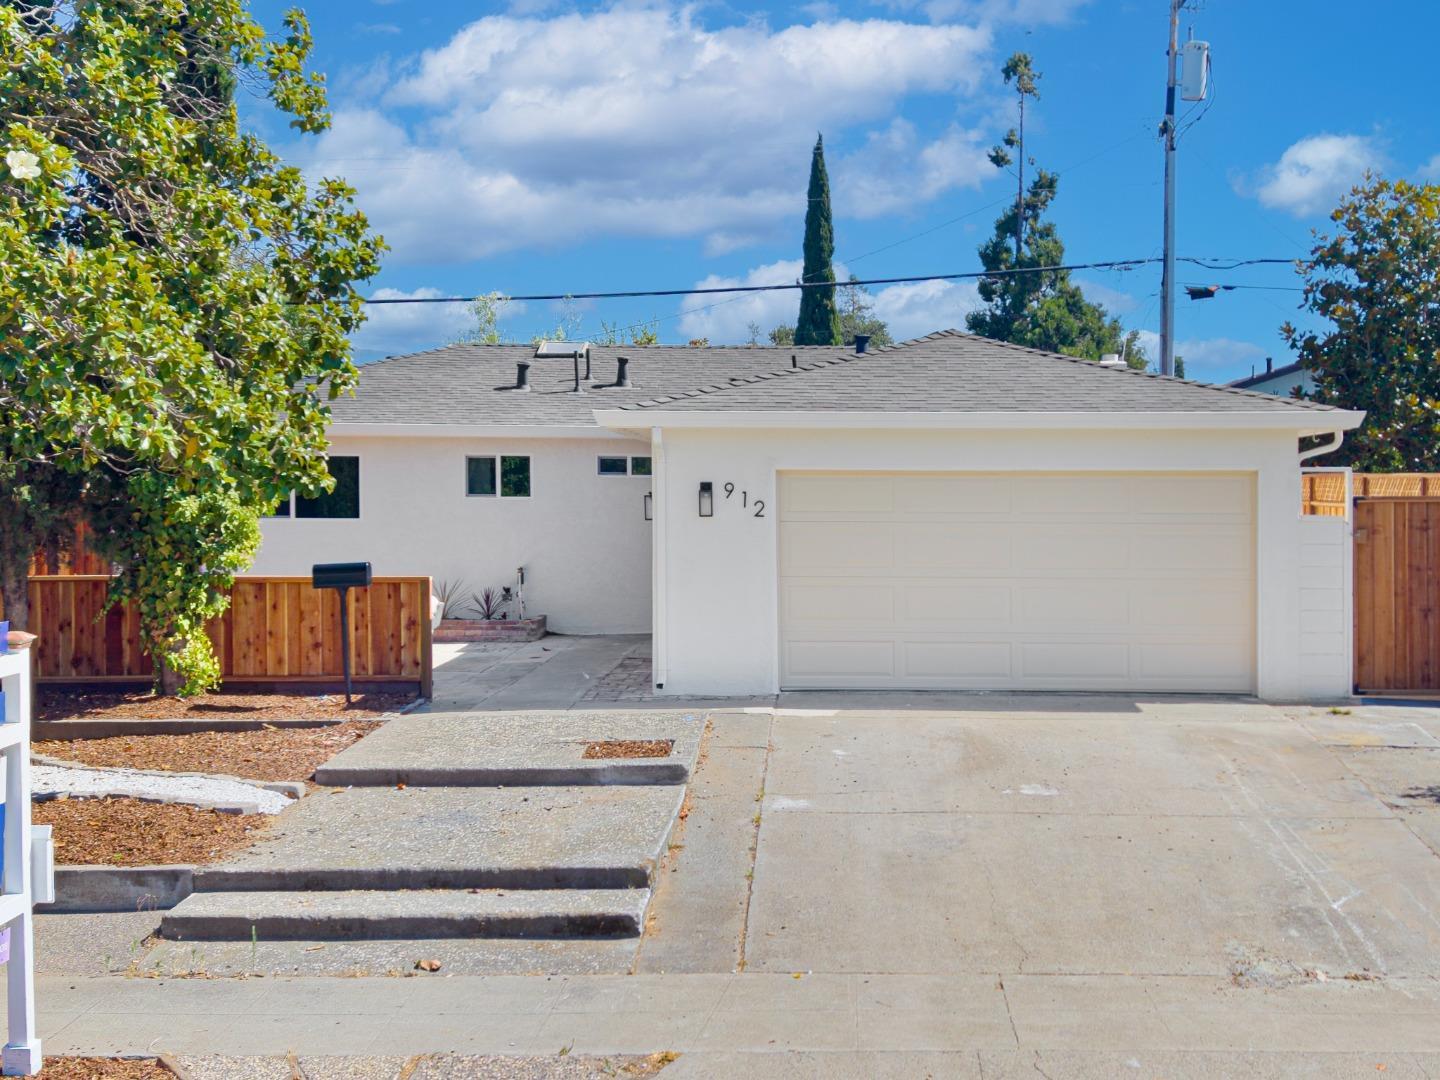
Back on the market 8 months after it last sold, 912 Connie Drive is asking $275,000 more
912 Connie Drive recorded as sold in January 2026 for $1,560,000. It hit the market again in August asking $1,835,000. The gap is $275,000 in 7.5 months.
140 S Peter Drive recorded as sold for $5.7 million, the highest price Campbell has seen in two years
The sale cleared the prior 24-month high by 25 percent and landed at the top of 286 transactions tracked across the city. Here is what the record bought and where it sits in the market.