Campbell Records 312 Closings and $565.8M in Volume for 2025, With a $1.45M Spread Between Segments
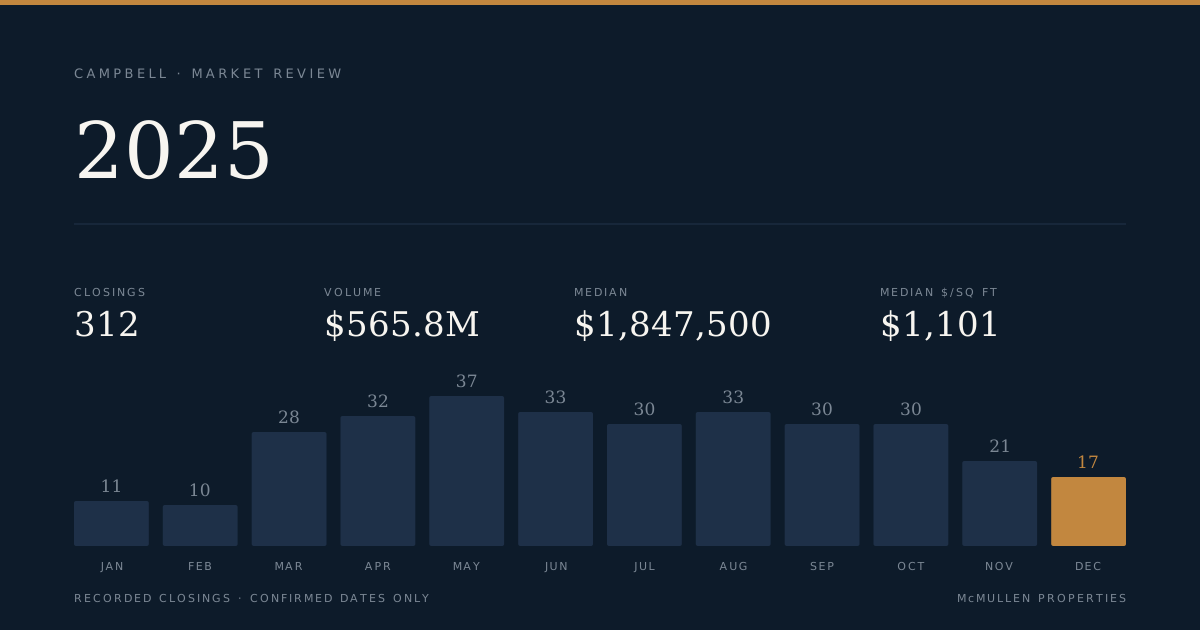
The period at a glance
| Metric | 2025 Full Year |
|---|---|
| Total closings | 312 |
| Total volume | $565,822,500 |
| Overall median price | $1,847,500 |
| Overall median $/sf | $1,101 |
| Overall median size | 1,507 sf |
| Median lot size | 6,344 sf |
| Price range | $500,000 – $4,365,000 |
| Median days on market | 10 (reported on all 312 closings) |
| Fastest closings (under 7 days) | 108 of 312 |
| Slowest closings (over 60 days) | 18 of 312 |
List prices were not available in the source data for this period.
The number that frames 2025 in Campbell is not the median — it is the distance between the top and bottom of the market. A single-family home at the top of the roster closed at $4,365,000; a condominium at the floor closed at $500,000. Those two figures share a city boundary and little else. The overall median of $1,847,500 sits closer to the single-family segment's $2,140,000 than to the townhouse median of $1,210,000 or the condominium median of $696,944, because single-family homes accounted for 209 of the 312 closings — two-thirds of all transactions.
Pace was the other story. Days on market were recorded on all 312 closings, giving a complete picture: the median was 10 days. More than a third of all closings — 108 of 312 — recorded fewer than seven days on market. Eighteen closings sat longer than 60 days, and one, at 229 Budd Avenue, reached 191 days before closing at $4,300,000. The spread between the fastest and slowest transactions is 191 days, which is a market of parallel realities rather than a single tempo.
The sales
The table below shows the top 40 closings by price from the full 312-sale period. It is not a complete record.
| Address | Segment | Beds | Sqft | $/sf | Closed | DOM | Sale Price |
|---|---|---|---|---|---|---|---|
| 1320 Theresa Avenue | Single Family | 6 | 4,529 | $963.79 | Sep 26 | 0 | $4,365,000 |
| 229 Budd Avenue | Single Family | 7 | 3,427 | $1,254.74 | Oct 2 | 70 | $4,300,000 |
| 635 Chapman Drive | Single Family | 5 | 3,374 | $1,206.28 | May 10 | 7 | $4,070,000 |
| 1639 Walters Ave | Single Family | 5 | 3,054 | $1,159.14 | May 10 | 2 | $3,540,000 |
| 109 Trailblazer Place | Single Family | 5 | 3,113 | $1,121.11 | Mar 11 | 0 | $3,490,000 |
| 107 Trailblazer Place | Single Family | 6 | 3,113 | $1,070.45 | Mar 11 | 0 | $3,332,300 |
| 206 Catalpa Lane | Single Family | 3 | 2,694 | $1,224.94 | Jun 10 | 6 | $3,300,000 |
| 1270 W Hacienda Avenue | Single Family | 5 | 2,848 | $1,141.15 | Aug 6 | 4 | $3,250,000 |
| 1416 Cameo Drive | Single Family | 4 | 2,496 | $1,296.07 | Jun 20 | 7 | $3,235,000 |
| 103 Trailblazer Place | Single Family | 5 | 2,848 | $1,134.13 | Mar 3 | 8 | $3,230,000 |
| 105 Trailblazer Place | Single Family | 5 | 2,848 | $1,111.24 | Mar 3 | 132 | $3,164,800 |
| 1181 Steinway Avenue | Single Family | 5 | 2,654 | $1,186.89 | Aug 25 | 5 | $3,150,000 |
| 195 N 3rd Street | Single Family | 4 | 3,062 | $1,028.74 | Aug 25 | 54 | $3,150,000 |
| 1340 E Campbell | Single Family | 4 | 2,716 | $1,136.97 | May 1 | 9 | $3,088,000 |
| 904 Capri Drive | Single Family | 5 | 2,944 | $1,046.20 | Aug 25 | 7 | $3,080,000 |
| 1445 Westmont Avenue | Single Family | 4 | 2,682 | $1,139.08 | Mar 7 | 6 | $3,055,000 |
| 357 N Milton Avenue | Single Family | 4 | 1,968 | $1,549.80 | Apr 28 | 7 | $3,050,000 |
| 503 De Carli Court | Single Family | 4 | 2,944 | $1,027.51 | Sep 5 | 1 | $3,025,000 |
| 107 Jasmine Court | Single Family | 4 | 2,599 | $1,154.29 | Sep 27 | 52 | $3,000,000 |
| 1149 S San Tomas Aquino Rd #A | Single Family | 5 | 2,630 | $1,140.68 | Sep 24 | 14 | $3,000,000 |
| 1466 Vale Avenue | Single Family | 4 | 2,288 | $1,298.08 | Apr 24 | 8 | $2,970,000 |
| 110 S 2nd Street | Single Family | 4 | 2,372 | $1,247.89 | Jul 8 | 6 | $2,960,000 |
| 780 Virginia Avenue | Single Family | 3 | 2,159 | $1,349.24 | Mar 12 | 4 | $2,913,000 |
| 1175 Archer Way | Single Family | 5 | 2,046 | $1,420.82 | Mar 12 | 7 | $2,907,000 |
| 1573 Walnut Drive | Single Family | 3 | 2,292 | $1,265.27 | Nov 10 | 0 | $2,900,000 |
| 1364 Ridgeley Drive | Single Family | 4 | 2,587 | $1,120.99 | Jan 3 | 34 | $2,900,000 |
| 1170 Steinway Avenue | Single Family | 3 | 905 | $3,202.21 | Nov 6 | 5 | $2,898,000 |
| 1420 Burrows Road | Single Family | 3 | 1,820 | $1,587.91 | Mar 12 | 18 | $2,890,000 |
| 875 Emory Avenue | Single Family | 4 | 2,566 | $1,100.94 | Nov 10 | 9 | $2,825,000 |
| 1585 Dry Creek Road | Single Family | 5 | 2,200 | $1,272.73 | Apr 28 | 20 | $2,800,000 |
| 1110 Cameo Dr | Single Family | 3 | 1,898 | $1,475.24 | Oct 17 | 0 | $2,800,000 |
| 1280 Burrows Road | Single Family | 4 | 2,892 | $963.64 | Apr 14 | 6 | $2,786,850 |
| 1372 Hoffman Lane | Single Family | 4 | 3,160 | $854.43 | May 23 | 5 | $2,700,000 |
| 1341 E Campbell Avenue | Single Family | 4 | 2,112 | $1,264.20 | Aug 25 | 30 | $2,670,000 |
| 970 W Hedegard Avenue | Single Family | 4 | 2,690 | $985.13 | Jul 7 | 33 | $2,650,000 |
| 1224 Cameo Drive | Single Family | 3 | 1,971 | $1,344.50 | May 21 | 5 | $2,650,000 |
| 635 Virginia Avenue | Single Family | 5 | 2,124 | $1,224.11 | Jun 23 | 0 | $2,600,000 |
| 1080 Audrey Avenue | Single Family | 3 | 2,034 | $1,278.27 | Apr 18 | 6 | $2,600,000 |
| 1330 El Moro Drive | Single Family | 3 | 1,841 | $1,402.91 | May 22 | 14 | $2,582,750 |
| 4129 W Rincon Avenue | Single Family | 5 | 1,974 | $1,306.99 | Oct 10 | 12 | $2,580,000 |
Four transactions are worth reading separately.
1320 Theresa Avenue closed at $4,365,000 on September 26 — the year's highest sale price — yet posted a per-square-foot rate of $963.79, the lowest among the top-ten by price. At 4,529 square feet on an 11,070-square-foot lot, built in 2025, it is the largest home in the roster. Its zero-day DOM means it never appeared on the open market before the closing date was recorded.
229 Budd Avenue is the year's second-highest close at $4,300,000, but it required 70 days and carries the highest per-square-foot rate in the entire top-40 at $1,254.74 — despite being a 3,427-square-foot, seven-bedroom new construction. The 70-day lag and the eventual price are both facts; the relationship between them is not one the record explains.
1170 Steinway Avenue closed November 6 at $2,898,000 on a 905-square-foot structure built in 1948, yielding $3,202.21 per square foot — the highest rate in the full roster by a significant margin. The 22,119-square-foot lot is the most plausible explanation for the price, though the record does not state the buyer's reasoning.
105 Trailblazer Place and 103 Trailblazer Place closed on the same day, March 3, at $3,164,800 and $3,230,000 respectively — both 2,848-square-foot new construction on nearly identical lots in the same development. 103 closed in 8 days. 105 required 132 days and closed $65,200 lower.
Where the market split
By segment
| Segment | Closings | Median Price | Median $/sf | Median Size | Price Range |
|---|---|---|---|---|---|
| Single Family | 209 | $2,140,000 | $1,229/sf | 1,664 sf | $1,250,000 – $4,365,000 |
| Townhouse | 57 | $1,210,000 | $786/sf | 1,465 sf | $510,324 – $1,748,000 |
| Condominium | 46 | $696,944 | $777/sf | 903 sf | $500,000 – $1,750,000 |
The single-family segment ran at a median that was 77% above the townhouse median and 207% above the condominium median. On a per-square-foot basis, single-family homes at $1,229/sf ran 56% above the townhouse rate of $786/sf and 58% above the condominium rate of $777/sf. The near-identical per-square-foot medians for townhouses and condominiums — $786 versus $777 — are worth noting: on a size-adjusted basis, the two non-single-family segments priced almost identically, even though the condominium median home is 562 square feet smaller and $513,056 cheaper in absolute terms.
The condominium segment's price ceiling of $1,750,000 and the townhouse ceiling of $1,748,000 are almost exactly coincident, while the single-family floor of $1,250,000 sits above the top of both ranges. In practice, the three segments occupy non-overlapping price bands for their medians, though their extremes do not quite touch.
By price band
| Band | Closings | Median $/sf |
|---|---|---|
| Under $1M | 55 | $742/sf |
| $1M – $1.5M | 51 | $853/sf |
| $1.5M – $2M | 76 | $1,141/sf |
| $2M – $3M | 110 | $1,347/sf |
| $3M – $5M | 20 | $1,140/sf |
The most active band by count was $2M–$3M with 110 closings, followed by $1.5M–$2M with 76. Together those two bands accounted for 186 of 312 closings — nearly 60% of annual volume. The under-$1M band recorded 55 closings, almost entirely condominiums and townhouses given the segment floors.
The per-square-foot inversion between the $2M–$3M band ($1,347/sf) and the $3M–$5M band ($1,140/sf) is the sharpest structural finding in the year's data. Homes closing between $2M and $3M carried a higher median rate per square foot than homes closing between $3M and $5M. This reflects the composition of each band: the $3M–$5M tier contained a meaningful share of larger new-construction homes where additional square footage was priced at lower incremental rates. The $2M–$3M band, by contrast, included many smaller but highly valued older homes on large lots. The record shows the rates; it does not explain the reasoning of the parties involved.
Across the year
| Month | Closings | Median Price | Median $/sf |
|---|---|---|---|
| Jan 2025 | 11 | $1,360,000 | $1,063/sf |
| Feb 2025 | 10 | $1,820,000 | $919/sf |
| Mar 2025 | 28 | $2,012,500 | $1,137/sf |
| Apr 2025 | 32 | $1,840,000 | $1,139/sf |
| May 2025 | 37 | $1,780,000 | $1,085/sf |
| Jun 2025 | 33 | $1,820,000 | $1,104/sf |
| Jul 2025 | 30 | $1,821,500 | $1,034/sf |
| Aug 2025 | 33 | $1,910,000 | $1,053/sf |
| Sep 2025 | 30 | $1,975,444 | $1,090/sf |
| Oct 2025 | 30 | $1,847,500 | $1,128/sf |
| Nov 2025 | 21 | $1,425,000 | $948/sf |
| Dec 2025 | 17 | $1,950,000 | $1,101/sf |
January and February together recorded 21 closings — the thinnest consecutive two-month stretch of the year. The medians in those months should be read with that sample size in mind: 11 closings in January produce a median of $1,360,000 that is more sensitive to individual transactions than the 37-closing May figure.
Volume ramped sharply from February into March (10 to 28 closings) and peaked in May at 37 — the busiest single month of the year. May also marked the highest individual monthly closing count for the Trailblazer Place development cluster, with Chapman Drive and Walters Avenue in that same spring window. The median price was highest in March at $2,012,500, reflecting the concentration of new-construction Trailblazer closings in that month. The per-square-foot median tracked similarly, peaking in March and holding a relatively narrow corridor of $1,034 to $1,141 through the core spring and summer months.
September posted the second-highest monthly median price at $1,975,444 across 30 closings — a level not sustained into October, which fell back to $1,847,500. November's median dropped to $1,425,000 across 21 closings, the lowest of any month with more than 15 sales. December recovered to $1,950,000 on 17 closings, though at that sample size the figure reflects a small and likely compositionally different pool than the spring peak months.
The overall direction of the per-square-foot median through 2025 was essentially flat with seasonal noise: a February low of $919/sf, a March–April plateau near $1,137–$1,139, a summer trough near $1,034–$1,053 in July–August, and a partial recovery through fall before November softened again. No sustained directional trend — upward or downward — is visible across the 12-month record.
What it means
For sellers
The year's data shows that 108 of 312 closings — 35% — recorded fewer than seven days on market, while 18 closings required more than 60 days. Both outcomes occurred in the same year, in the same city, sometimes in the same development (as the Trailblazer Place closings illustrate: three days and eight days for comparable units, 132 days for a fourth). The segment and price band a property occupies shapes the pool of eligible buyers substantially: the $2M–$3M band was the most active by transaction count, while the $3M–$5M band recorded only 20 closings across the full year.
For buyers
The condominium and townhouse segments together accounted for 103 closings with medians of $696,944 and $1,210,000 respectively, both well below the overall market median of $1,847,500. The under-$1M band recorded 55 closings — a functioning tier of the market, not a rounding error. The $1.5M–$2M band was the second-most active by closings at 76, and posted a median per-square-foot rate of $1,141 — lower than both the $2M–$3M band above it and, notably, lower than the overall single-family median of $1,229/sf. The fastest closings were heavily concentrated in the under-seven-day cohort: 108 of them. Eighteen closings took longer than 60 days, suggesting that a subset of inventory moved at a materially different pace from the majority.
For owners not transacting
The full-year median of $1,847,500 across 312 closings, with a total recorded volume of $565,822,500, reflects a market that sustained transaction activity across all twelve months without a break. The lightest month by closings was February at 10; the heaviest was May at 37. The year's price range — $500,000 to $4,365,000 — encompasses properties that share a city designation and little else in terms of size, age, construction type, or lot characteristics. The per-square-foot figure of $3,202.21 at 1170 Steinway Avenue and $854.43 at 1372 Hoffman Lane both closed in 2025 Campbell — a spread that is a product of lot size, structure age, and configuration, not a single legible market signal.
Tim McMullen · Tim McMullen, Broker · CA DRE #02016832
[email protected] · (415) 691-9272
More from Campbell
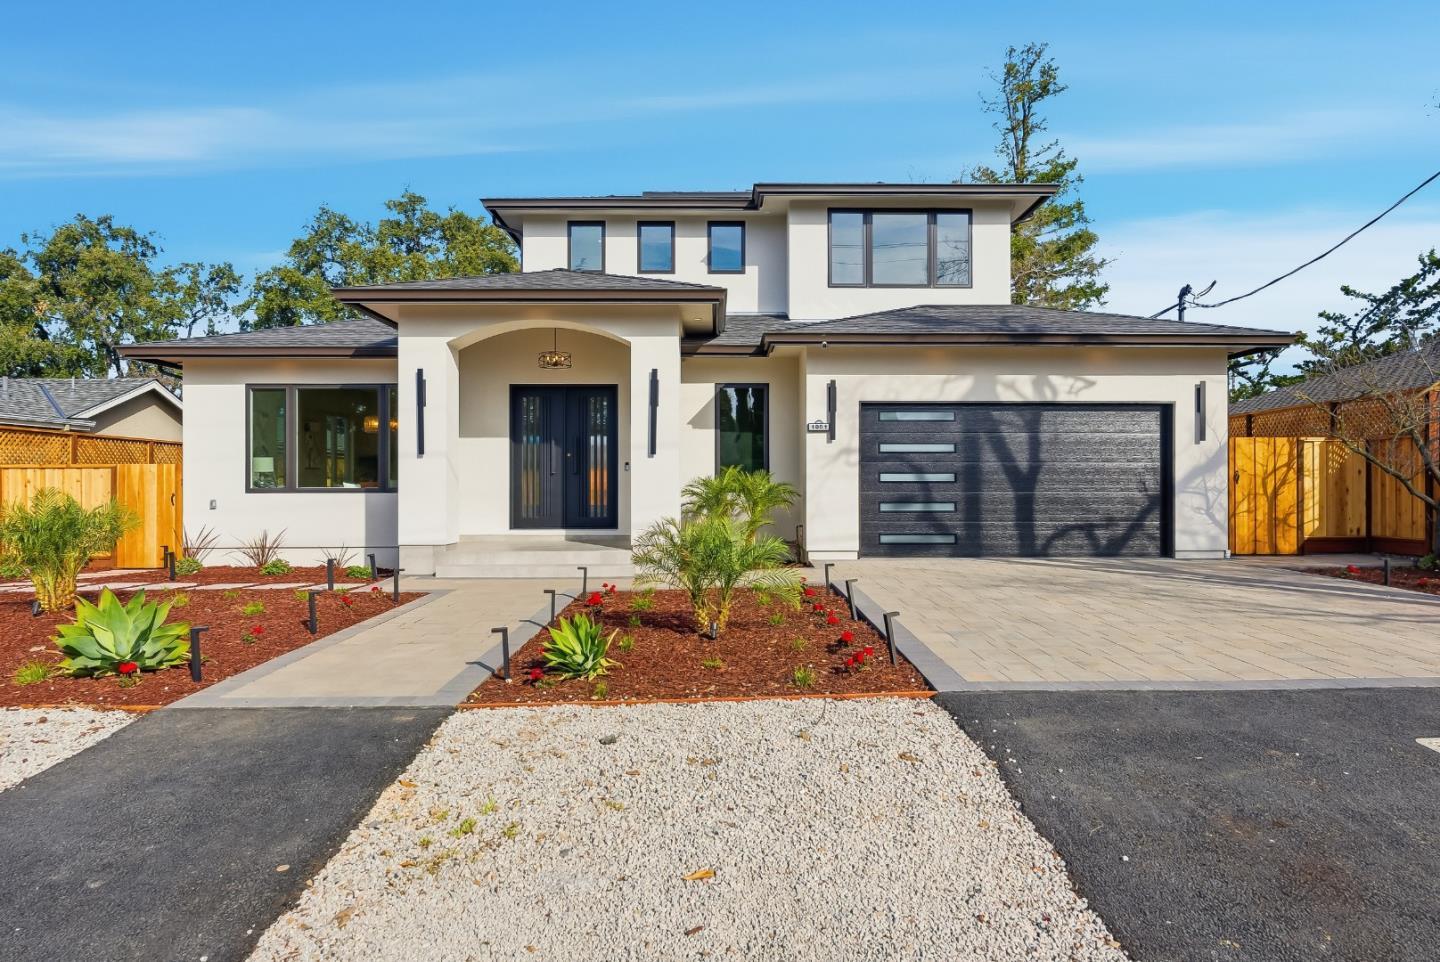
Campbell Q1 2026: 42 Closings, $76M in Volume, and a Median That Fell $408K in Three Months
Forty-two transactions closed across Campbell in Q1 2026, totaling $76.1 million. The overall median price began the quarter at $1,978,888 in January and ended at $1,570,000 in March — a 21 percent slide driven by a shift in the mix of what closed each month.
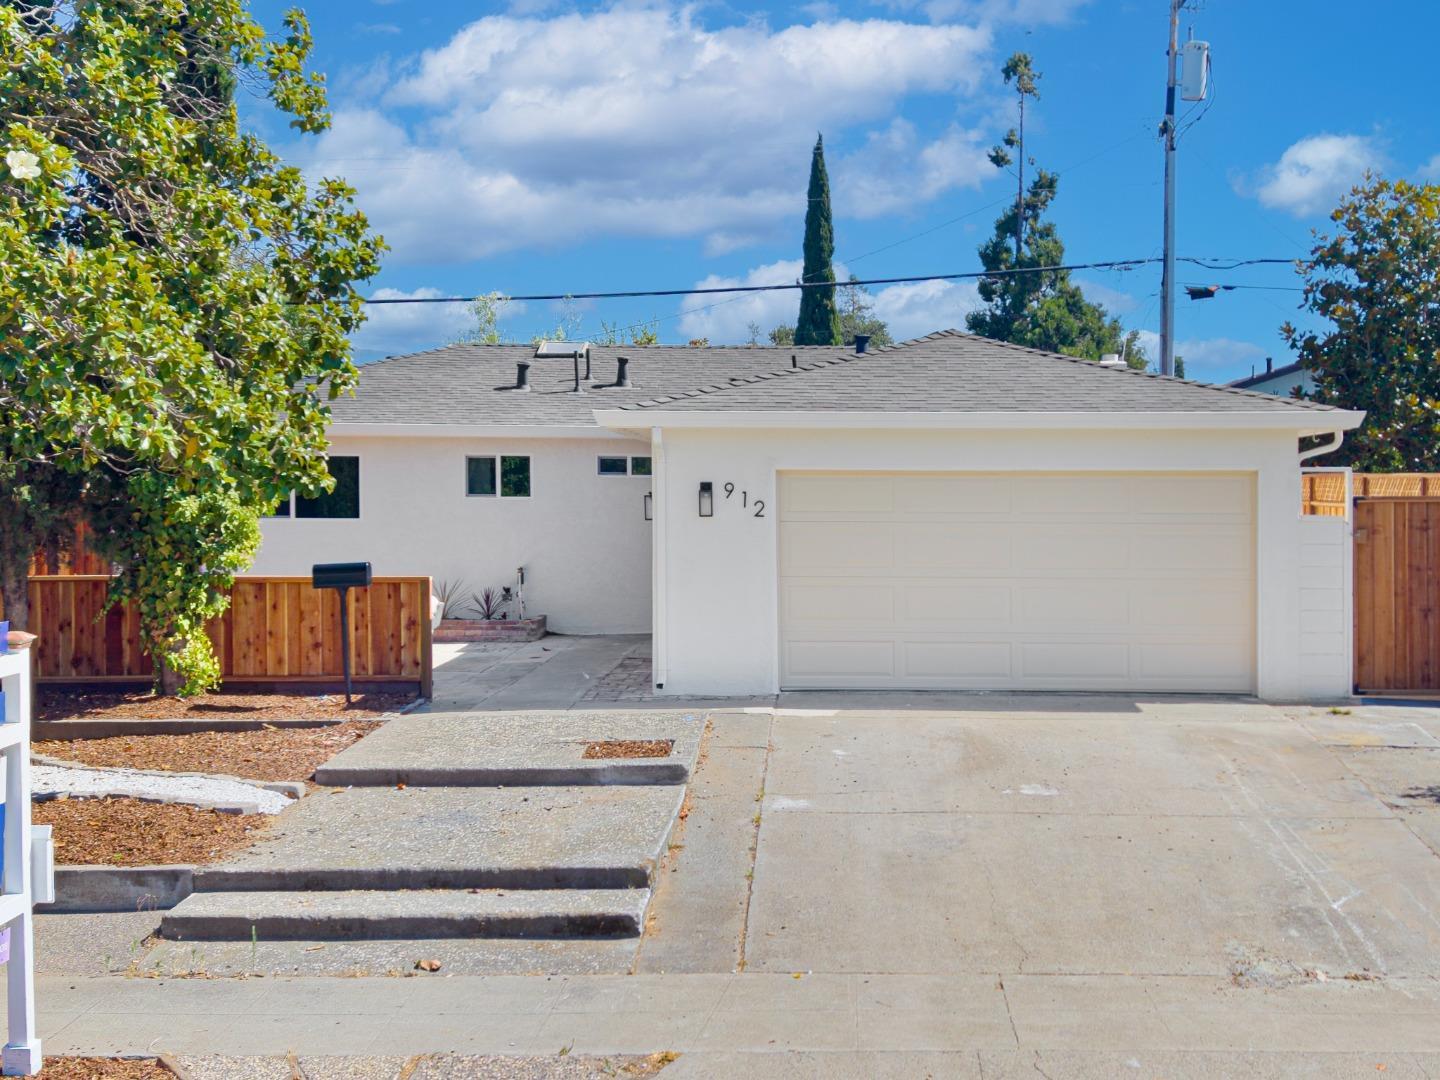
Back on the market 8 months after it last sold, 912 Connie Drive is asking $275,000 more
912 Connie Drive recorded as sold in January 2026 for $1,560,000. It hit the market again in August asking $1,835,000. The gap is $275,000 in 7.5 months.
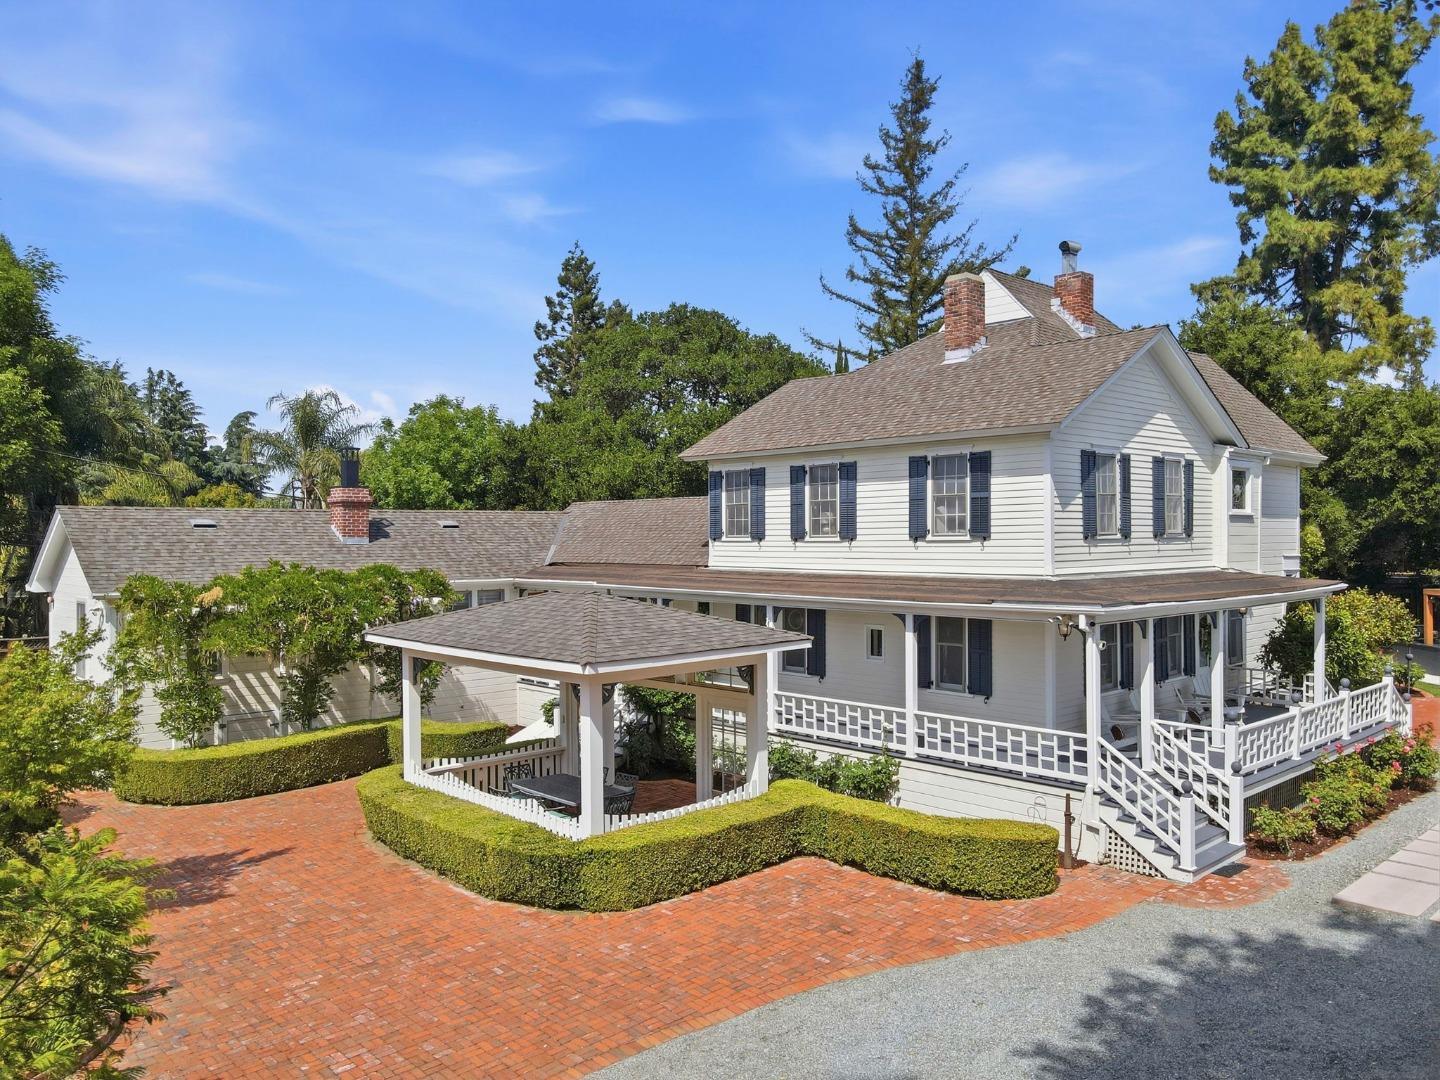
140 S Peter Drive recorded as sold for $5.7 million, the highest price Campbell has seen in two years
The sale cleared the prior 24-month high by 25 percent and landed at the top of 286 transactions tracked across the city. Here is what the record bought and where it sits in the market.