Campbell Q3 2026 Market Report
The period at a glance
List-price data is available for this period but days-on-market figures are recorded for only 13 of 61 closings, so speed comparisons carry limited weight and are noted where relevant rather than used as a primary lens.
| Metric | Q3 2026 |
|---|---|
| Total closings | 61 |
| Total volume | $112,377,387 |
| Median sale price | $1,785,000 |
| Median price per sq ft | $1,068 |
| Median living area | 1,678 sq ft |
| Median lot size | 6,317 sq ft |
| Price range | $510,000 – $5,700,000 |
| Months in period | July – September 2026 |
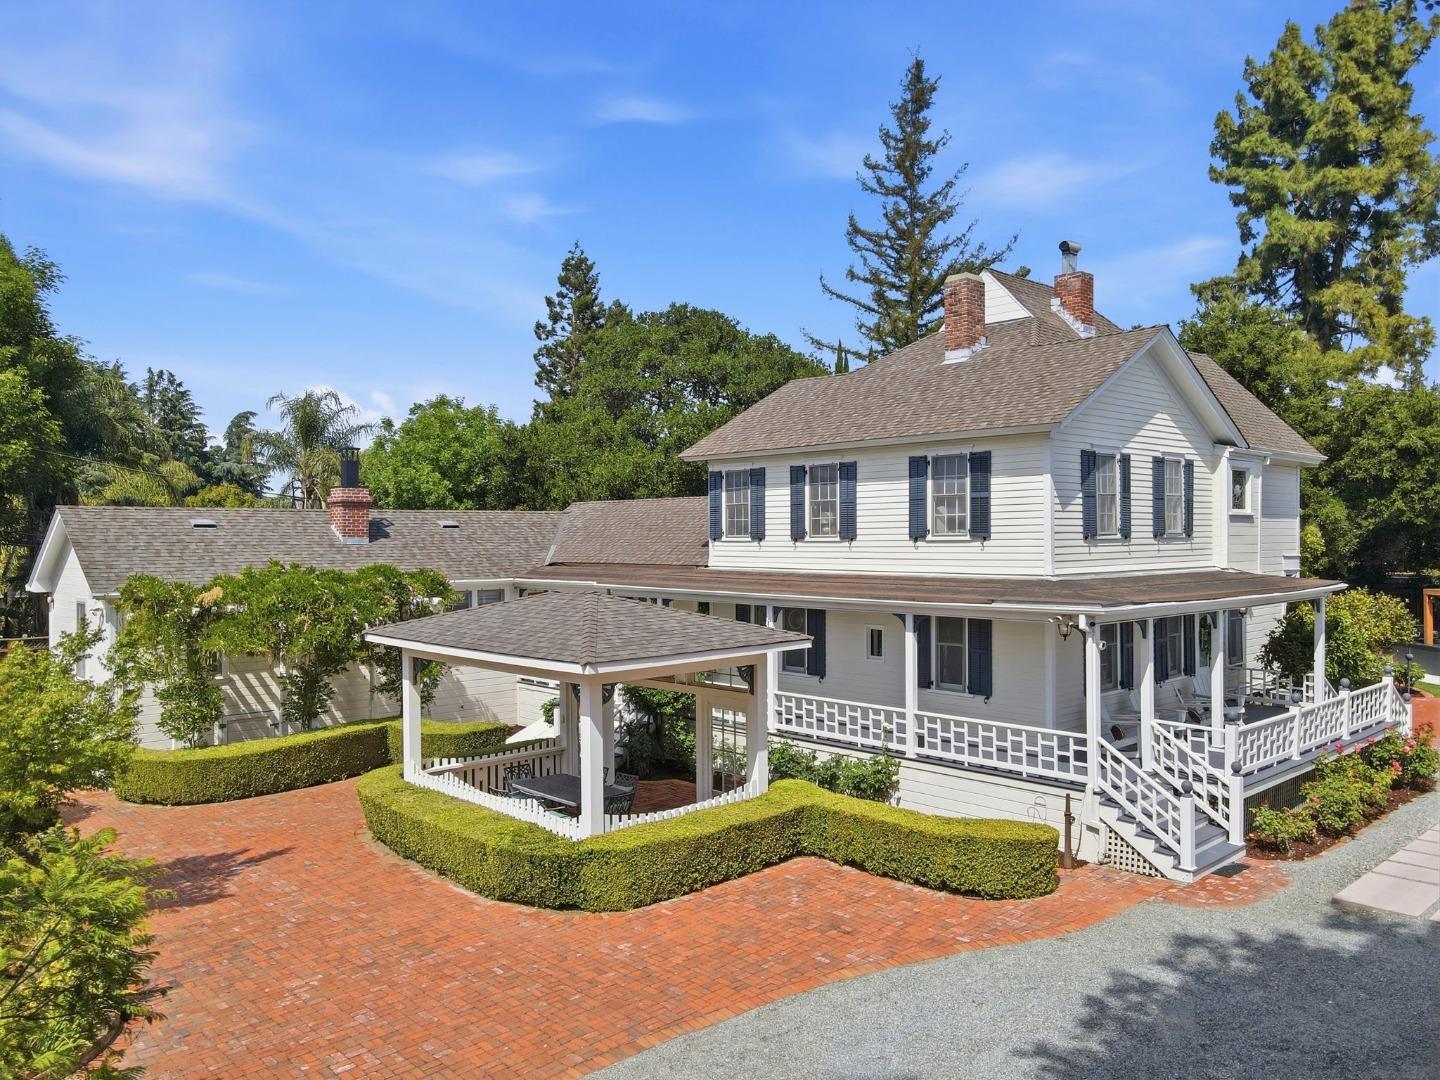
Sixty-one closings across three segments produced a quarter shaped more by its extremes than its middle. A single transaction at 140 S Peter Drive — $5.7 million, a 4,012-square-foot home on 35,616 square feet of land — sat roughly three times the segment median and lifted single-family volume noticeably. Strip that one sale and the quarter reads as a steady, mid-seven-figure market anchored in the $1.5M–$2M band, which alone accounted for 23 of 61 closings.
The gap between segments is the defining structural fact of the quarter. Single-family homes recorded a median of $1,968,000. Townhouses came in at $1,308,931 — a $659,000 spread. Condominiums, six closings in total, posted a median of $667,500, less than a third of the single-family figure. A buyer's segment choice carried more dollar consequence than almost any other variable in the period.
The sales
The table below shows the top 40 transactions by price. The full period count is 61 closings.
| Address | Segment | Beds | Sq Ft | $/Sq Ft | Sale Price | Closed | DOM |
|---|---|---|---|---|---|---|---|
| 140 S Peter Drive | Single Family | 4 | 4,012 | $1,421 | $5,700,000 | Aug 31 | — |
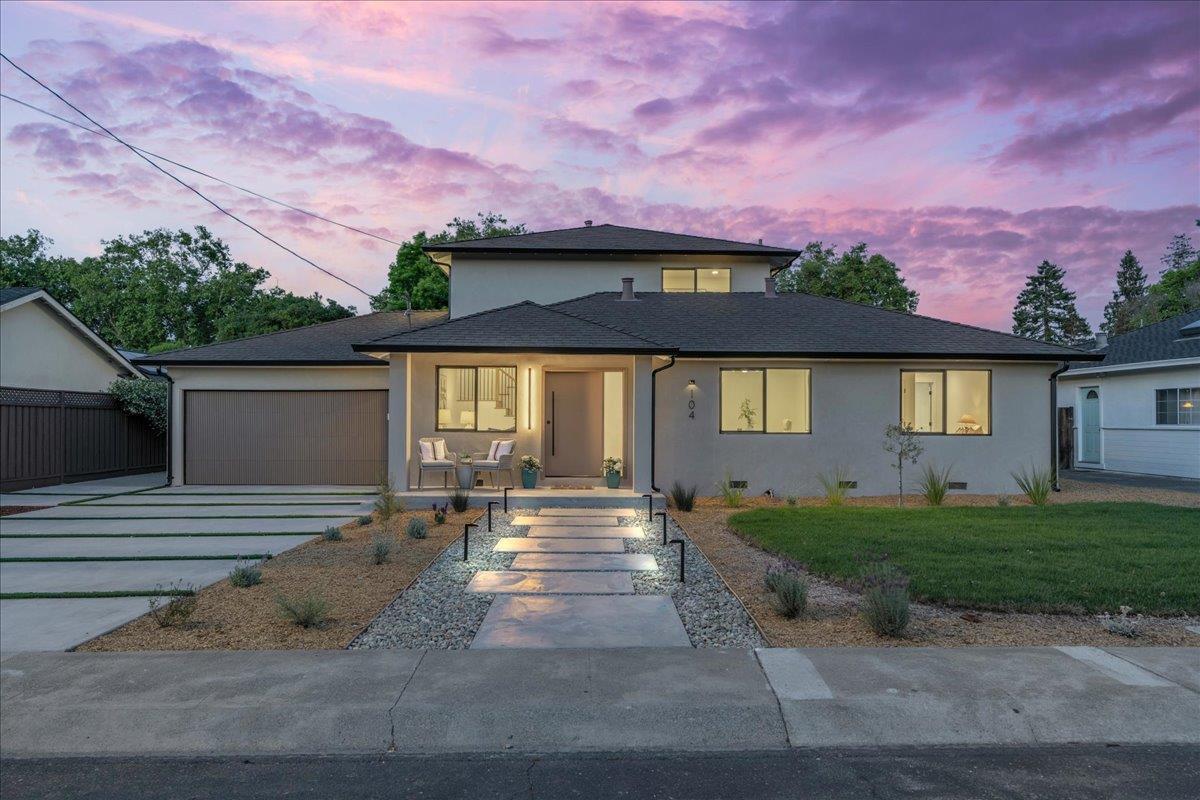
| 104 Hardy Avenue | Single Family | 6 | 3,318 | $1,100 | $3,650,000 | Aug 31 | — |
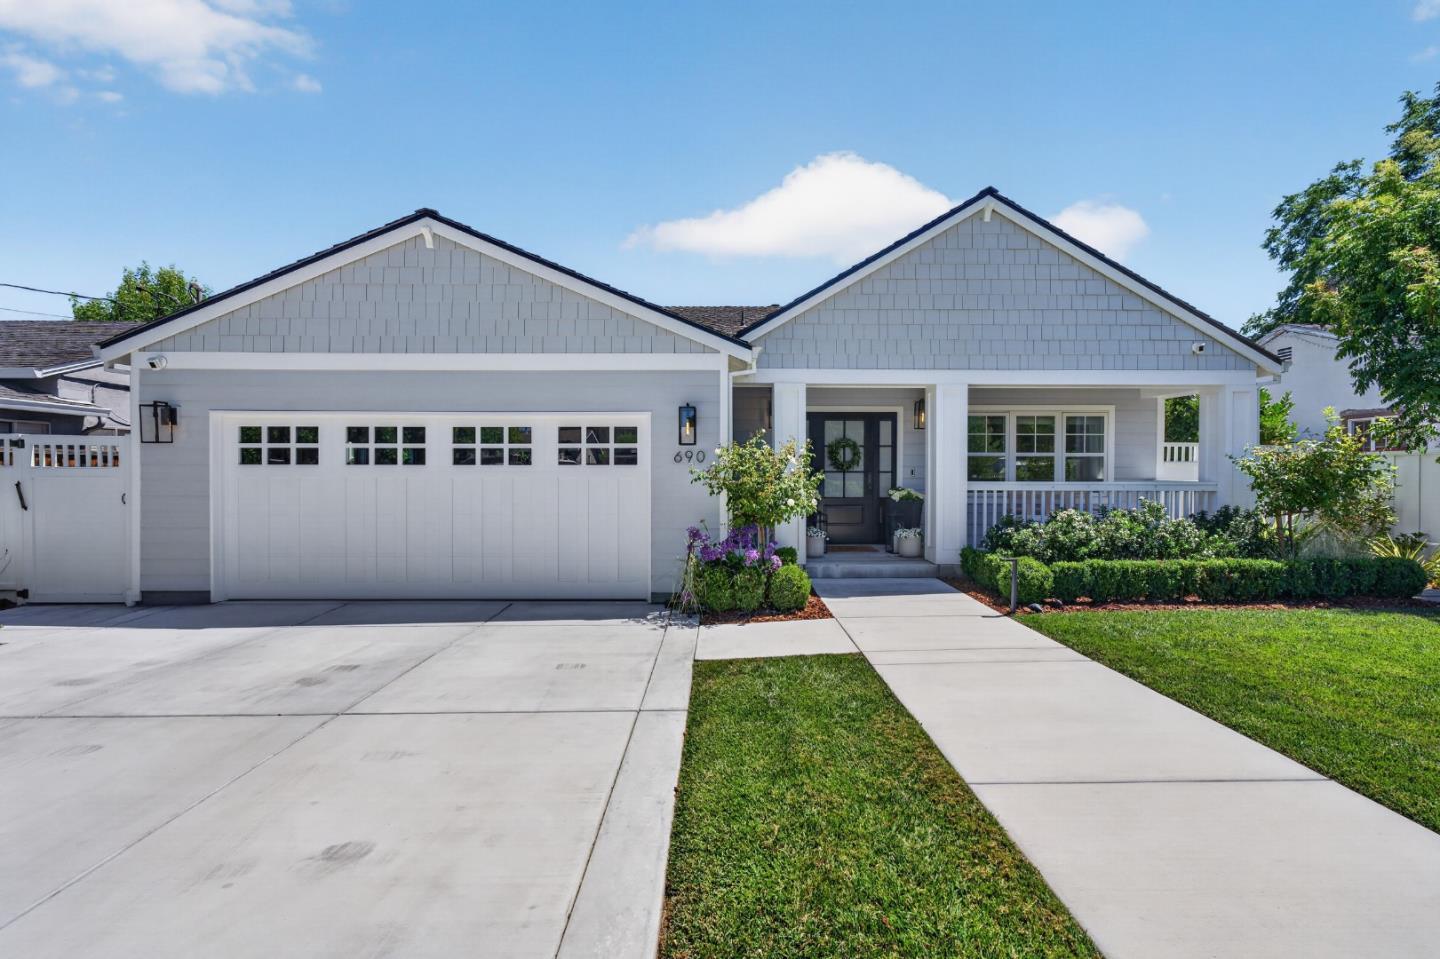
| 690 Elden Drive | Single Family | 3 | 2,515 | $1,312 | $3,300,000 | Sep 18 | — |
| 1422 York Avenue | Single Family | 2 | 888 | $3,378 | $3,000,000 | Jul 23 | 3 |
| 1324 Bent Drive | Single Family | 3 | 2,225 | $1,225 | $2,725,000 | Aug 20 | — |
| 1346 El Moro Drive | Single Family | 4 | 2,454 | $1,100 | $2,700,000 | Sep 8 | — |
| 499 W Latimer Ave #02-18 | Single Family | 4 | 2,578 | $1,017 | $2,622,148 | Aug 26 | — |
| 4765 Del Loma Court | Single Family | 4 | 1,870 | $1,401 | $2,620,000 | Aug 28 | — |
| 122 Sunnyside Court | Single Family | 4 | 2,996 | $871 | $2,610,000 | Sep 3 | — |
| 1631 Fawn Court | Single Family | 4 | 1,520 | $1,711 | $2,600,000 | Jul 30 | 14 |
| 134 Sunnyside Court | Single Family | 4 | 2,996 | $866 | $2,595,000 | Aug 26 | — |
| 2089 Orestes Way | Single Family | 4 | 1,992 | $1,230 | $2,450,000 | Jul 22 | 9 |
| 44 Sunnyside Avenue | Single Family | 4 | 2,996 | $778 | $2,332,000 | Sep 25 | — |
| 1305 Walnut Drive | Single Family | 2 | 1,854 | $1,236 | $2,291,000 | Jul 31 | 46 |
| 2114 La Miel Way | Single Family | 3 | 1,586 | $1,375 | $2,180,000 | Aug 26 | — |
| 1133 Erin Way | Single Family | 3 | 1,975 | $1,068 | $2,110,000 | Aug 17 | — |
| 28 N Peter Drive | Single Family | 3 | 1,697 | $1,237 | $2,100,000 | Jul 22 | — |
| 1235 Shamrock Drive | Single Family | 4 | 2,120 | $953 | $2,020,000 | Aug 4 | 6 |
| 2324 Montezuma Drive | Single Family | 5 | 1,980 | $1,014 | $2,008,000 | Sep 21 | — |
| 1180 Fewtrell Drive | Single Family | 3 | 1,800 | $1,111 | $2,000,000 | Aug 31 | — |
| 2293 Middletown Drive | Single Family | 4 | 1,512 | $1,316 | $1,990,000 | Aug 17 | — |
| 3813 Ainsley Court | Single Family | 4 | 1,711 | $1,152 | $1,971,000 | Jul 31 | — |
| 2261 Central Park Drive | Single Family | 4 | 1,687 | $1,165 | $1,965,000 | Aug 12 | 88 |
| 783 Loyalton Drive | Single Family | 4 | 1,702 | $1,153 | $1,963,000 | Sep 30 | — |
| 905 Sheila Court | Single Family | 3 | 1,326 | $1,471 | $1,950,000 | Sep 4 | — |
| 204 Hardy Avenue | Single Family | 3 | 1,437 | $1,357 | $1,950,000 | Sep 3 | — |
| 801 Monica Lane | Single Family | 4 | 2,056 | $934 | $1,920,000 | Sep 17 | — |
| 2827 Gazelle Drive | Single Family | 4 | 1,322 | $1,437 | $1,900,000 | Sep 21 | — |
| 1331 Patio Drive | Single Family | 3 | 1,752 | $1,042 | $1,825,000 | Aug 21 | — |
| 124 Lottie Lane | Townhouse | 4 | 2,100 | $857 | $1,800,000 | Jul 24 | 66 |
| 188 W Rincon Avenue | Single Family | 4 | 1,902 | $938 | $1,785,000 | Aug 28 | — |
| 912 Connie Drive | Single Family | 4 | 1,189 | $1,493 | $1,775,000 | Sep 25 | — |
| 1659 Silacci Drive | Single Family | 4 | 1,322 | $1,337 | $1,768,000 | Sep 28 | — |
| 181 Warwick Drive | Single Family | 3 | 1,229 | $1,359 | $1,670,000 | Sep 29 | — |
| 1341 Parsons Avenue | Single Family | 4 | 1,318 | $1,252 | $1,650,000 | Aug 27 | — |
| 188 Harrison Avenue | Single Family | 3 | 1,733 | $952 | $1,650,000 | Sep 8 | — |
| 224 Marianna Way | Single Family | 3 | 1,092 | $1,465 | $1,600,000 | Sep 21 | — |
| 816 Mary Court | Single Family | 3 | 1,108 | $1,431 | $1,585,000 | Aug 21 | — |
| 1001 W Latimer Avenue | Single Family | 3 | 1,464 | $1,076 | $1,575,000 | Aug 31 | — |
| 670 W Rincon Avenue | Single Family | 3 | 1,211 | $1,263 | $1,530,000 | Sep 18 | — |
Four transactions define the quarter's outer edges. At the top, 140 S Peter Drive closed at $5.7 million on August 31 — a 1900-built home on 35,616 square feet of land, a lot size that dwarfs virtually every other parcel in the period. At $1,421 per square foot across 4,012 square feet, the price-per-foot figure is less remarkable than the sheer scale of the transaction; it was the only closing above $4 million in the quarter.
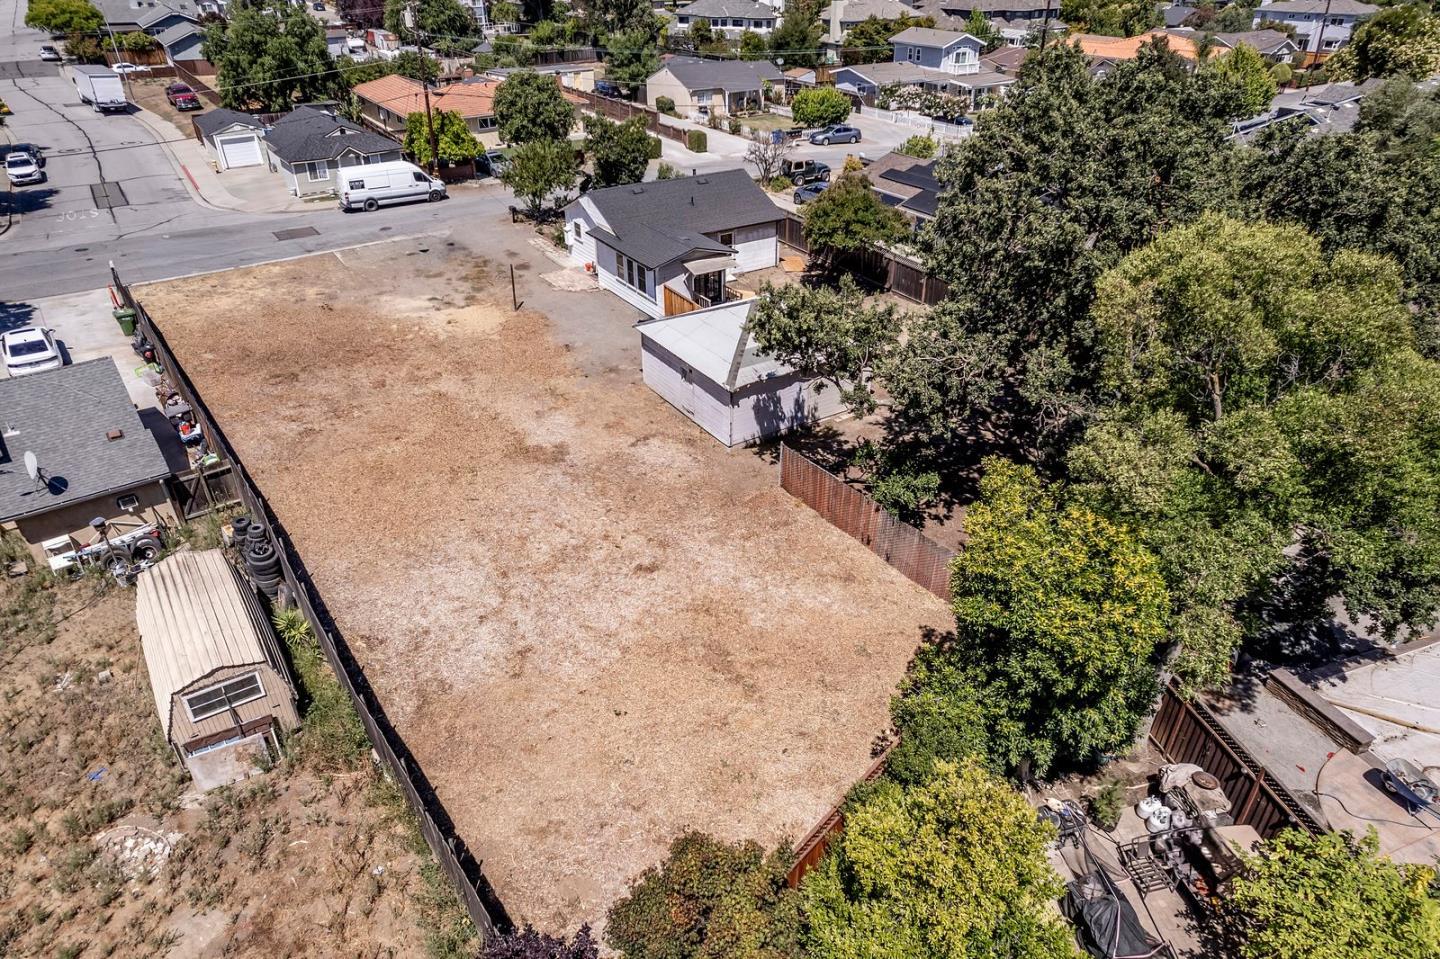
At 1422 York Avenue, a two-bedroom, 888-square-foot home on a 17,850-square-foot lot closed at $3,000,000 — $3,378 per square foot, the highest unit rate in the entire roster. It was on the market three days. The lot premium is the evident driver; the structure itself is modest. That $3,000 per-foot figure should not be read as a benchmark for the broader single-family market, which recorded a segment median of $1,159 per foot.
On the other end of the recorded speed spectrum, 2261 Central Park Drive sat 88 days before closing at $1,965,000, and 1305 Walnut Drive — a two-bedroom at $2,291,000 — took 46 days. Both cleared above the segment median, suggesting the extended marketing periods reflected property-specific circumstances rather than price-level resistance, though the data does not say which.
The Sunnyside Court cluster deserves a note. Three new-construction single-family homes on adjacent parcels — 122 Sunnyside Court ($2,610,000), 134 Sunnyside Court ($2,595,000), and 44 Sunnyside Avenue ($2,332,000) — all closed in August and September at 2,996 square feet each. Their per-foot figures ranged from $778 to $871, well below the single-family segment median of $1,159. New construction at volume carries its own pricing logic.
Where the market split
By segment
| Segment | Closings | Median Price | Median $/Sq Ft | Median Sq Ft | Price Range |
|---|---|---|---|---|---|
| Single Family | 44 | $1,968,000 | $1,159 | 1,707 sq ft | $1,250,000 – $5,700,000 |
| Townhouse | 11 | $1,308,931 | $765 | 1,678 sq ft | $610,000 – $1,800,000 |
| Condominium | 6 | $667,500 | $649 | 1,045 sq ft | $510,000 – $1,077,375 |
Single-family homes dominated the quarter by count (44 of 61 closings) and by price. The median living area was nearly identical between single-family (1,707 sq ft) and townhouse (1,678 sq ft), which makes the $659,000 spread in median prices — $1,968,000 versus $1,308,931 — a reflection of land value and structure type rather than size alone.
Condominiums, six closings in the quarter, produced a median of $667,500 at $649 per square foot. With only six closings, that median rests on a thin sample and individual transactions move it readily. The range — $510,000 to $1,077,375 — spans more than a half-million dollars across six sales, which itself signals heterogeneity within the segment. No sub-segment trend should be read into six data points.
The lone townhouse entry in the top-40 roster, 124 Lottie Lane, closed at $1,800,000 after 66 days on market — the highest townhouse price in the period and well above the segment median of $1,308,931. At 2,100 square feet and $857 per foot, it priced at a significant premium to the segment norm. The other ten townhouse closings are not in the roster but anchor the segment's median lower.
By price band
| Price Band | Closings | Median $/Sq Ft |
|---|---|---|
| Under $1M | 8 | $649 |
| $1M – $1.5M | 10 | $836 |
| $1.5M – $2M | 23 | $1,165 |
| $2M – $3M | 16 | $1,106 |
| $3M – $5M | 3 | $1,312 |
| $5M and up | 1 | $1,421 |
The $1.5M–$2M band was the busiest in the quarter by a wide margin: 23 closings, more than a third of all transactions. It also posted a higher median per-foot figure ($1,165) than the $2M–$3M band directly above it ($1,106). The inversion is worth noting — buyers spending between $2M and $3M received, on a per-foot basis, less than those in the band below, consistent with the larger-footprint new-construction sales in the $2M–$2.7M range pulling that band's average down.
The $3M–$5M band held only three closings — the minimum for a median, which is reported as $1,312 per foot. That figure comes from a sample of three and should be held lightly. The $5M-and-up band is a single transaction.
The under-$1M band's eight closings align with the condominium segment, which recorded a median of $667,500 and a price ceiling of $1,077,375 — all six condominium closings fall within that band. The $1M–$1.5M band's ten closings at $836 per foot likely include the balance of townhouses and lower-priced single-family entries not captured in the top-40 roster.
Across the quarter
| Month | Closings | Median Price | Median $/Sq Ft |
|---|---|---|---|
| July 2026 | 11 | $1,971,000 | $1,152 |
| August 2026 | 27 | $1,785,000 | $1,017 |
| September 2026 | 23 | $1,768,000 | $1,100 |
July was the thinnest month by volume — 11 closings — but posted the highest median price ($1,971,000) and the highest median per-foot figure ($1,152). August nearly tripled the closing count to 27, with the median price dropping to $1,785,000 and per-foot to $1,017. September brought 23 closings, a median of $1,768,000, and a partial per-foot recovery to $1,100.
Two things are worth separating here. The July median rests on 11 closings — a thin monthly sample where a concentration of higher-end single-family sales moves the figure materially. August's surge in volume — 27 closings, the quarter's busiest month — included the three Sunnyside Court new-construction transactions, whose lower per-foot figures pulled the monthly average down. September's per-foot figure of $1,100 splitting the difference between the two earlier months is a partial correction of that composition effect.
The quarter-over-quarter direction of median price — from $1,971,000 in July to $1,768,000 in September — is a $203,000 nominal decline across three months. Whether that reflects genuine softening or a shift in the mix of what closed in each month cannot be determined from the aggregate figures alone.
What it means
For sellers: The $1.5M–$2M single-family band absorbed 23 transactions in a single quarter, more than any other price range — the market's clearest zone of activity. Homes in that band carried a median of $1,165 per square foot. Above $2M, the per-foot figure drops despite the higher absolute prices, a pattern driven partly by larger homes and new construction. The 88-day and 66-day outliers in the recorded DOM figures signal that extended time on market did not necessarily prevent a transaction from closing above certain price points, but those are two data points from a 13-of-61 sample and draw no general conclusion.
For buyers: The three segments represent meaningfully different price floors and per-foot rates. Condominiums entered the quarter at $510,000 and closed with a median of $667,500 at $649 per foot; townhouses at $765 per foot; single-family at $1,159 per foot. New-construction single-family entries — several of them in the $2.3M–$2.6M range — came in at $778–$1,017 per foot, below the resale single-family median, though the parcels are smaller. The composition of what is available in any given month shifts the options considerably, as July's thin inventory compared with August's 27 closings illustrates.
For owners not transacting: Total volume of $112.4 million across 61 closings produces an average transaction of roughly $1.84 million — close to the $1.785M median, which means the distribution is not dramatically skewed by the $5.7M outlier. The quarter's single-family median of $1,968,000 across 44 closings is the most statistically grounded reference point for that segment. The condominium and townhouse figures rest on smaller samples — 6 and 11 closings, respectively — and are subject to more variance quarter to quarter.
Tim McMullen · CA DRE #02016832
[email protected] · (415) 691-9272
Press kit: figures & citation for this report →
More Campbell market reports
Campbell September 2026 Market Report
208 Kamson Way closed 45% over ask — but Campbell's September median landed at $1,768,000 across 23 sales
Campbell 2025 Market Report
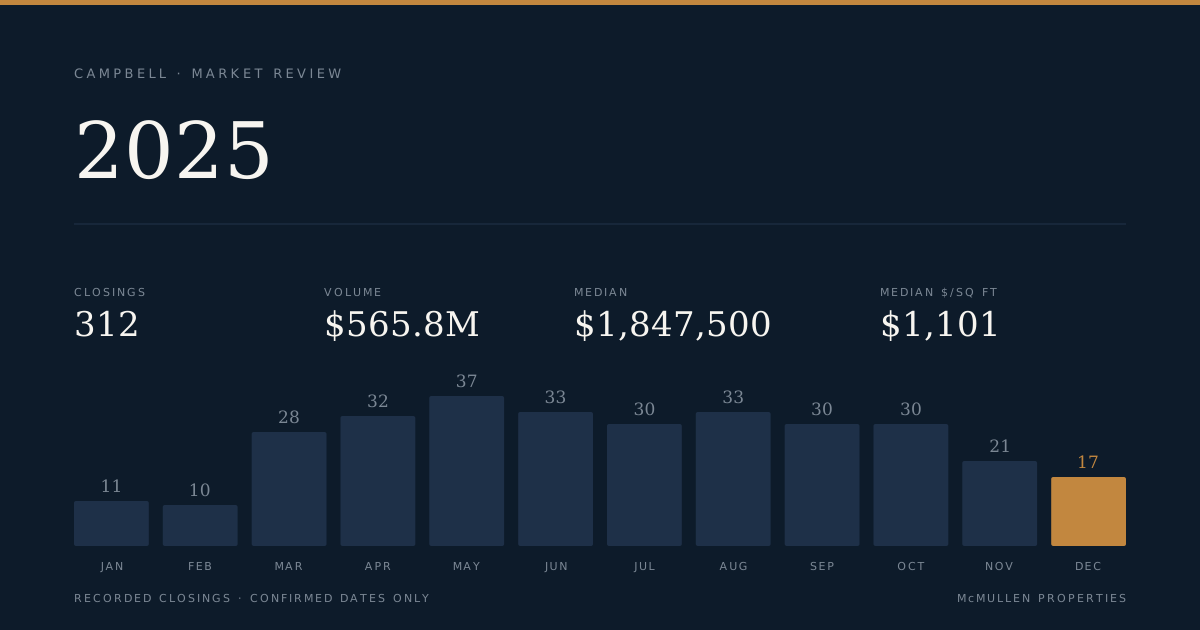
Campbell Records 312 Closings and $565.8M in Volume for 2025, With a $1.45M Spread Between Segments
Campbell Q1 2026 Market Report
Campbell Q1 2026: 42 Closings, $76M in Volume, and a Median That Fell $408K in Three Months