Campbell September 2026 Market Report
The period at a glance
| Metric | September 2026 | September 2025 |
|---|---|---|
| Closings | 23 | 30 |
| Median sale price | $1,768,000 | $1,975,444 |
| Median price per sq ft | $1,100 | $1,090 |
| Total volume | $40,167,933 | — |
| Price range | $555,000 – $3,300,000 | — |
| Over asking (of 22 with list prices) | 11 | — |
| Under asking | 11 | — |
| Median % of list | 99.2% | — |
Twenty-three closings is a small sample — noted here once, factored in throughout. With that caveat front of mind, September's numbers carry some genuine tension. The overall median price per square foot came in at $1,100, essentially flat against September 2025's $1,090, yet the median sale price fell from $1,975,444 to $1,768,000 year-over-year. That gap is largely a composition effect: this September's closings skewed toward smaller single-family homes and included two condominiums and three townhouses, pulling the aggregate price figure down even as per-square-foot pricing held. Closings also dropped from 30 to 23, meaning fewer transactions spread across a wider price range — from $555,000 to $3,300,000.
The even 11-11 split between over-ask and under-ask closings (one sale carried no list price) produced a median ratio of 99.2%, which means the midpoint transaction landed fractionally below its asking price. That symmetry obscures the extremes: one home closed 45.3% above list, and the steepest discount in the period was 7.2% below. Days on market data was not recorded for any of the 23 closings, so no speed analysis is possible.
The sales
The table below shows all 23 closings recorded for September 2026.
| Address | Segment | Beds | Sq Ft | Sale Price | $/Sq Ft | % of List | Closed |
|---|---|---|---|---|---|---|---|
| 690 Elden Drive | Single Family | 3 | 2,515 | $3,300,000 | $1,312 | 110.2% | Sep 18 |
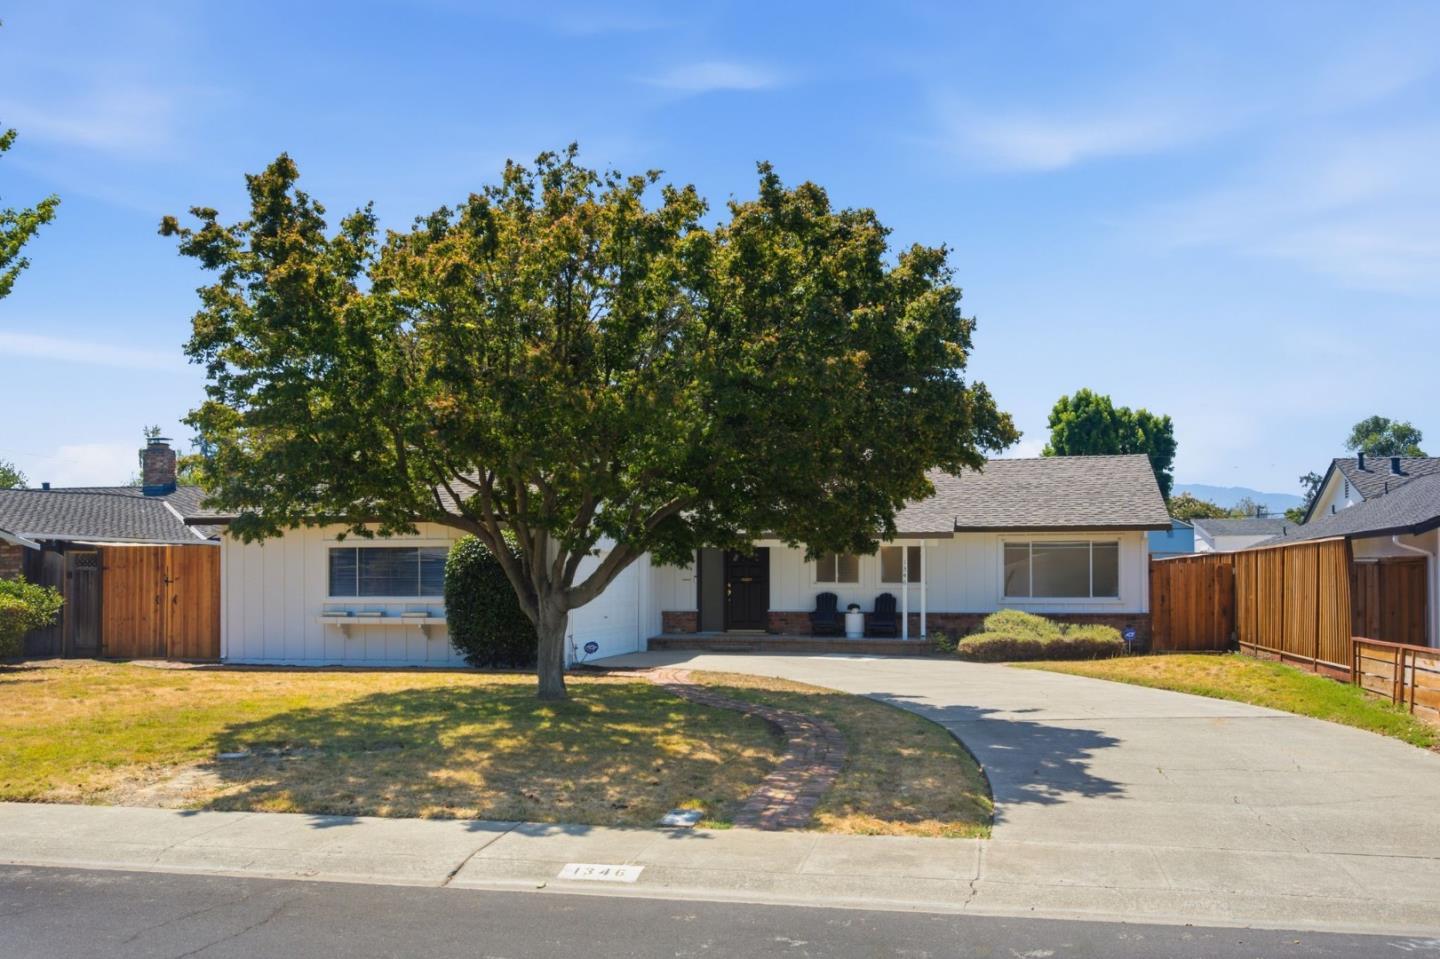
| 1346 El Moro Drive | Single Family | 4 | 2,454 | $2,700,000 | $1,100 | 108.1% | Sep 8 |
| 122 Sunnyside Court | Single Family | 4 | 2,996 | $2,610,000 | $871 | 97.0% | Sep 3 |
| 44 Sunnyside Avenue | Single Family | 4 | 2,996 | $2,332,000 | $778 | 101.8% | Sep 25 |
| 2324 Montezuma Drive | Single Family | 5 | 1,980 | $2,008,000 | $1,014 | 100.5% | Sep 21 |
| 783 Loyalton Drive | Single Family | 4 | 1,702 | $1,963,000 | $1,153 | 98.2% | Sep 30 |
| 905 Sheila Court | Single Family | 3 | 1,326 | $1,950,000 | $1,471 | 103.1% | Sep 4 |
| 204 Hardy Avenue | Single Family | 3 | 1,437 | $1,950,000 | $1,357 | 93.1% | Sep 3 |
| 801 Monica Lane | Single Family | 4 | 2,056 | $1,920,000 | $934 | 96.1% | Sep 17 |
| 2827 Gazelle Drive | Single Family | 4 | 1,322 | $1,900,000 | $1,437 | 100.1% | Sep 21 |
| 912 Connie Drive | Single Family | 4 | 1,189 | $1,775,000 | $1,493 | 96.7% | Sep 25 |
| 1659 Silacci Drive | Single Family | 4 | 1,322 | $1,768,000 | $1,337 | 104.6% | Sep 28 |
| 181 Warwick Drive | Single Family | 3 | 1,229 | $1,670,000 | $1,359 | 98.4% | Sep 29 |
| 188 Harrison Avenue | Single Family | 3 | 1,733 | $1,650,000 | $952 | 97.2% | Sep 8 |
| 224 Marianna Way | Single Family | 3 | 1,092 | $1,600,000 | $1,465 | 106.8% | Sep 21 |
| 670 W Rincon Avenue | Single Family | 3 | 1,211 | $1,530,000 | $1,263 | 92.8% | Sep 18 |
| 84 Dot Avenue | Single Family | 3 | 1,354 | $1,500,000 | $1,108 | 94.0% | Sep 22 |
| 208 Kamson Way | Single Family | 3 | 1,394 | $1,450,000 | $1,040 | 145.3% | Sep 29 |
| 141 Orchard Oak Circle | Townhouse | 3 | 1,895 | $1,450,000 | $765 | 97.4% | Sep 4 |
| 279 Wagon Way #34-03 | Townhouse | 2 | 1,678 | $1,401,933 | $835 | — | Sep 5 |
| 5025 Pine Tree Terrace | Townhouse | 2 | 970 | $610,000 | $629 | 101.8% | Sep 20 |
| 207 Watson Drive #3 | Condominium | 2 | 903 | $575,000 | $637 | 96.0% | Sep 28 |
| 287 Watson Drive #2 | Condominium | 2 | 903 | $555,000 | $615 | 101.1% | Sep 4 |
Four transactions carry most of the explanatory weight this month.
208 Kamson Way produced the period's loudest number: $1,450,000 on a $998,000 list price, a 45.3% premium. A 1,394-square-foot, 3-bed home built in 1954 on a 6,900-square-foot lot, it closed September 29 at $1,040 per square foot. That single sale is responsible for the period's biggest-premium-pct figure and pulls any aggregate premium calculation sharply upward. Treat every summary statistic involving list-price ratios accordingly.
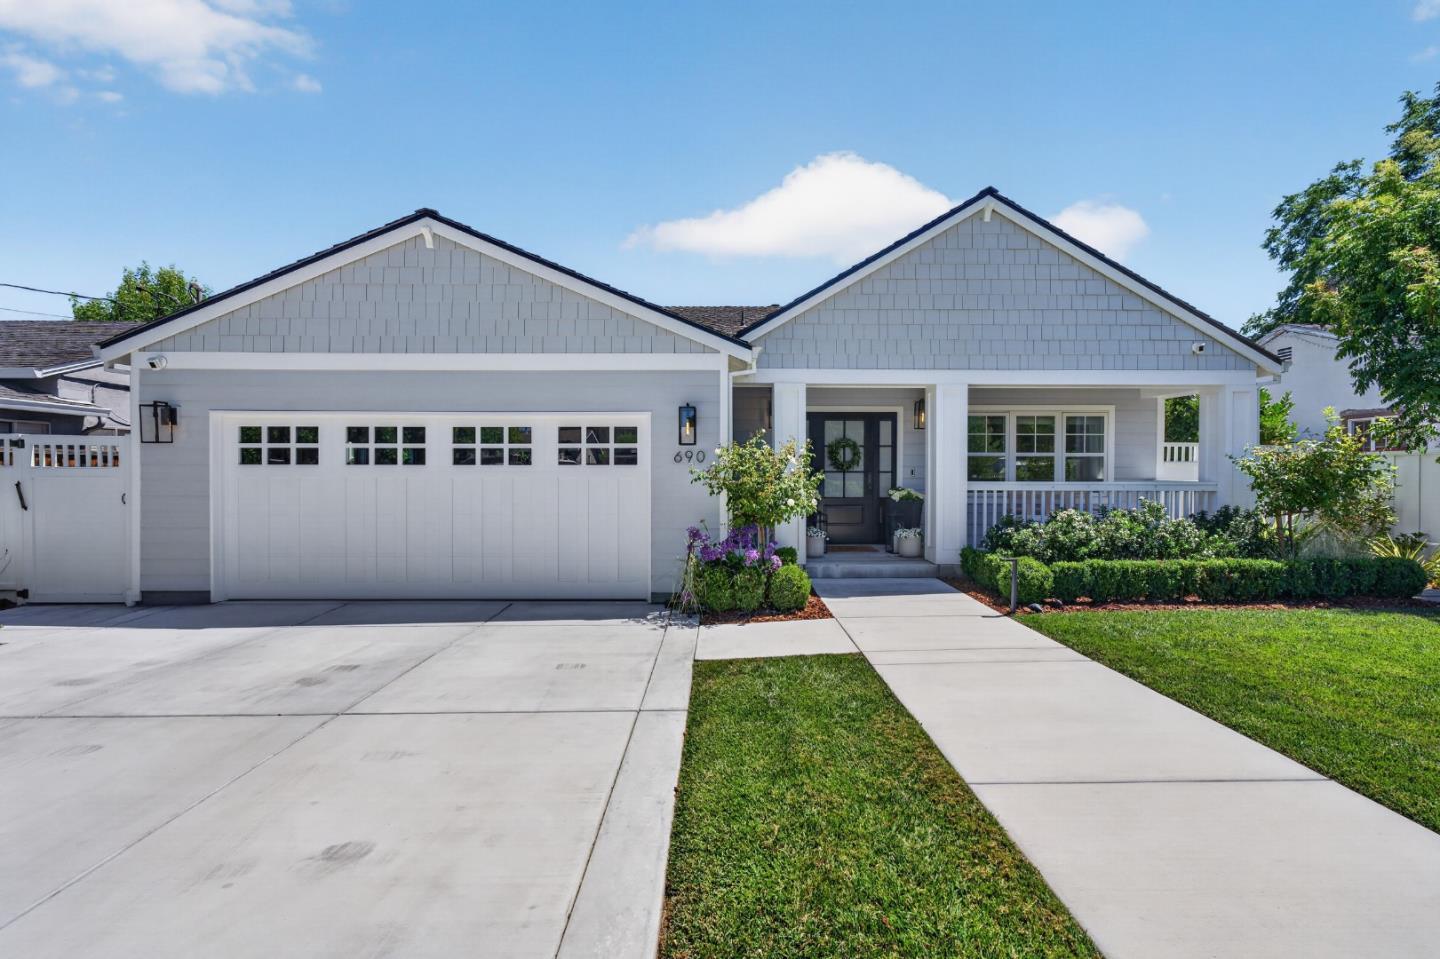
690 Elden Drive was the month's highest close at $3,300,000 — 110.2% of its $2,995,000 ask. At 2,515 square feet on a 10,860-square-foot lot, this 1947-built 3/4 produced $1,312 per square foot, the second-highest $/sq ft in the period.
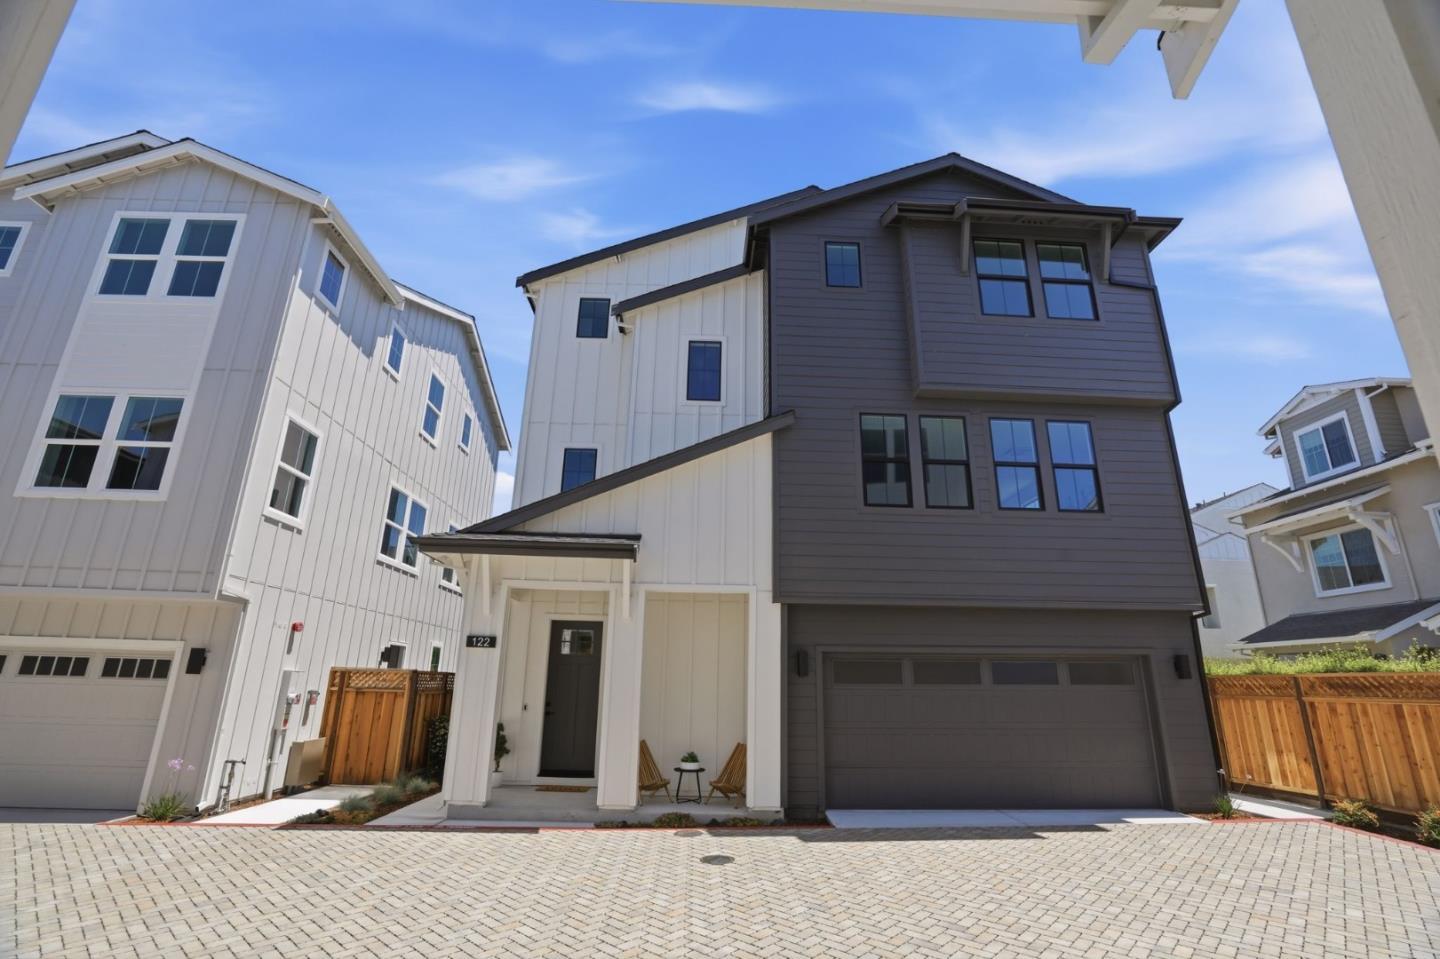
122 Sunnyside Court and 44 Sunnyside Avenue are a pair worth reading together. Both are brand-new 2026 construction at 2,996 square feet, effectively identical in size, on adjacent-scale lots of 2,174 and 2,235 square feet. Court closed September 3 at $2,610,000 (97% of ask, $871/sq ft); Avenue closed September 25 at $2,332,000 (101.8% of ask, $778/sq ft). A $278,000 gap on homes of the same vintage and footprint, closed three weeks apart, with no days-on-market data to add context.
204 Hardy Avenue at $1,950,000 is notable for going the other direction: a 1950-built 3-bed on a generous 9,375-square-foot lot that closed at 93.1% of its $2,095,000 list — a $145,000 discount, the second-largest in dollar terms this month.
Where the market split
By segment
| Segment | Closings | Median Price | Median $/Sq Ft | Median Sq Ft | Over Asking | Price Range |
|---|---|---|---|---|---|---|
| Single Family | 18 | $1,910,000 | $1,208 | 1,416 | 9 of 17* | $1,450,000 – $3,300,000 |
| Townhouse | 3 | $1,401,933 | $765 | 1,678 | 1 of 2* | $610,000 – $1,450,000 |
| Condominium | 2 | — | — | 903 | 1 of 2 | $555,000 – $575,000 |
*One single-family sale and one townhouse sale carried no list price and are excluded from over/under calculations.
The single-family segment drove the month. Eighteen closings across a $1.85 million spread produced a median of $1,910,000 and a median $1,208 per square foot — the segment median carrying enough sales (18) to be a reasonable reference point, though the outliers on both ends are wide.
The three townhouse closings span from $610,000 to $1,450,000, a range that reflects entirely different product types rather than price variation within a consistent type. The median of $1,401,933 rests almost entirely on the top sale; with only three closings, treat this as a range description rather than a trend signal.
The two condominium closings — both on Watson Drive, both 903 square feet, both 1971-built — closed within $20,000 of each other ($555,000 and $575,000). Two sales is not enough for a median. Their range is $555,000–$575,000, and at $615–$637 per square foot they represent the most affordable per-foot entry point in the period.
By price band
| Band | Closings | Median Price | Median $/Sq Ft |
|---|---|---|---|
| Under $1M | 3 | $575,000 | $629 |
| $1M–$1.5M | 3 | $1,450,000 | $835 |
| $1.5M–$2M | 12 | $1,771,500 | $1,347 |
| $2M–$3M | 4 | $2,471,000 | $943 |
| $3M–$5M | 1 | $3,300,000 | $1,312 |
The $1.5M–$2M band claimed more than half the month's closings — 12 of 23 — and its median per-square-foot of $1,347 is the highest of any band with more than one sale. The inverse appears in the $2M–$3M band: four closings at a median of $943 per square foot, well below the $1.5M–$2M band's figure. That inversion is partly explained by the two Sunnyside new-construction homes sitting in the $2M–$3M range at $778–$871 per square foot, pulling the band's $/sq ft figure down even as the sale prices are higher in absolute terms. The $3M–$5M band has a single sale and no median; $1,312/sq ft and $3,300,000 is the full description.
Across the period
| Month | Closings | Median Price | Median $/Sq Ft |
|---|---|---|---|
| Apr 2026 | 13 | $1,506,000 | $1,008 |
| May 2026 | 14 | $1,542,500 | $992 |
| Jun 2026 | 12 | $1,839,000 | $965 |
| Jul 2026 | 11 | $1,971,000 | $1,152 |
| Aug 2026 | 27 | $1,785,000 | $1,017 |
| Sep 2026 | 23 | $1,768,000 | $1,100 |
The six-month arc does not move in a straight line. Median price climbed from $1,506,000 in April to $1,971,000 in July, then pulled back in August and September to roughly $1,775,000–$1,785,000. Per-square-foot figures follow a similar shape: a trough in June at $965, a July peak at $1,152, and September settling at $1,100. August's 27 closings were the busiest month in the window; September's 23 represent a modest step down. Notably, the per-square-foot figure recovered in September relative to August ($1,100 vs. $1,017) even as median price was nearly flat ($1,768,000 vs. $1,785,000) — the September mix skewed toward smaller homes at higher per-foot prices.
What it means
For sellers. September's median of 99.2% of list — drawn from 22 sales with list prices — shows the midpoint transaction landing just under ask. Eleven homes closed above their list price and eleven below, with the spread between the biggest premium (45.3%) and the steepest discount (7.2%) wide enough that positioning mattered. The $1.5M–$2M band absorbed 12 of the month's 23 closings; that is where the activity concentrated. The $2M–$3M band saw only four closings, and two of those were new-construction product on Sunnyside.
For buyers. With 111 active listings and only 23 closings in September, the month closed with substantially more supply than absorption. Pending stands at 19. The active median asking price is $1,724,376 against a September closed median of $1,768,000 — active pricing is currently sitting below where homes have been closing, though list-to-close ratios vary enough that individual properties require individual analysis. No days-on-market data was recorded for this period, so how long active inventory has been sitting cannot be determined from this record.
For owners not transacting. The median price per square foot of $1,100 in September compares to $1,090 a year earlier — essentially unchanged on that measure. Median sale price declined year-over-year ($1,768,000 vs. $1,975,444), but the September 2025 figure rested on 30 closings and a different product mix. The per-foot figure, which adjusts partially for size differences, shows more stability than the headline price comparison suggests.
Tim McMullen · CA DRE #02016832
[email protected] · (415) 691-9272
Press kit: figures & citation for this report →
More Campbell market reports
Campbell Q3 2026 Market Report
Campbell Posts $112.4M in Q3 2026 — 61 Closings, One Sale at $5.7M, Median Lands at $1.785M
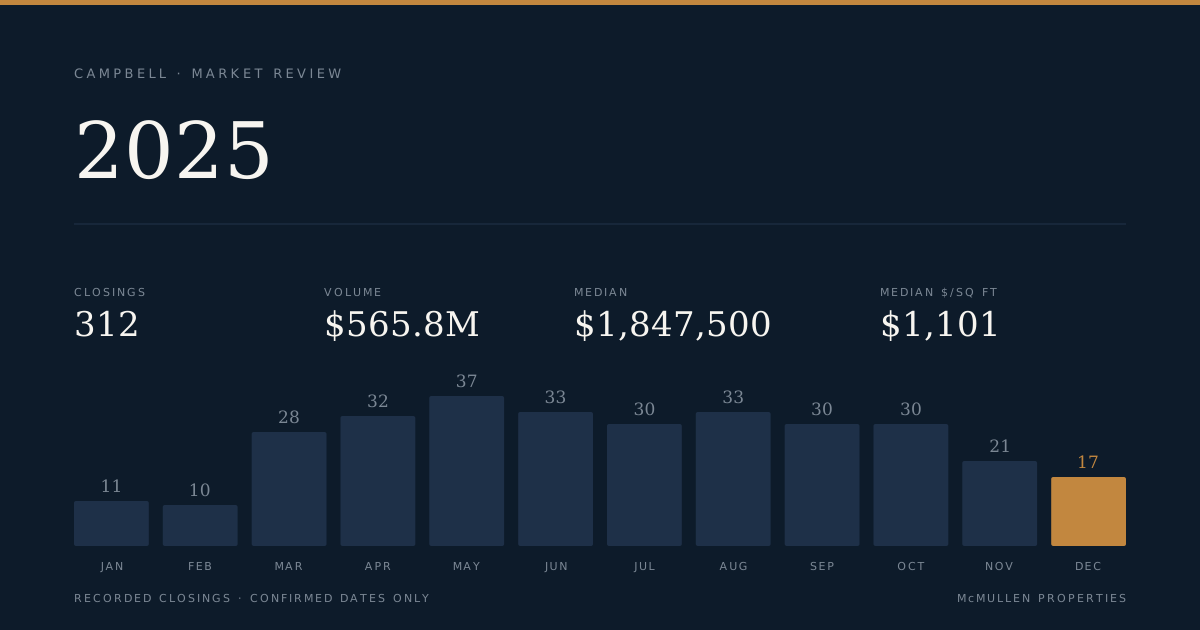
Campbell 2025 Market Report
Campbell Records 312 Closings and $565.8M in Volume for 2025, With a $1.45M Spread Between Segments
Campbell Q1 2026 Market Report
Campbell Q1 2026: 42 Closings, $76M in Volume, and a Median That Fell $408K in Three Months