140 S Peter Drive recorded as sold for $5.7 million, the highest price Campbell has seen in two years
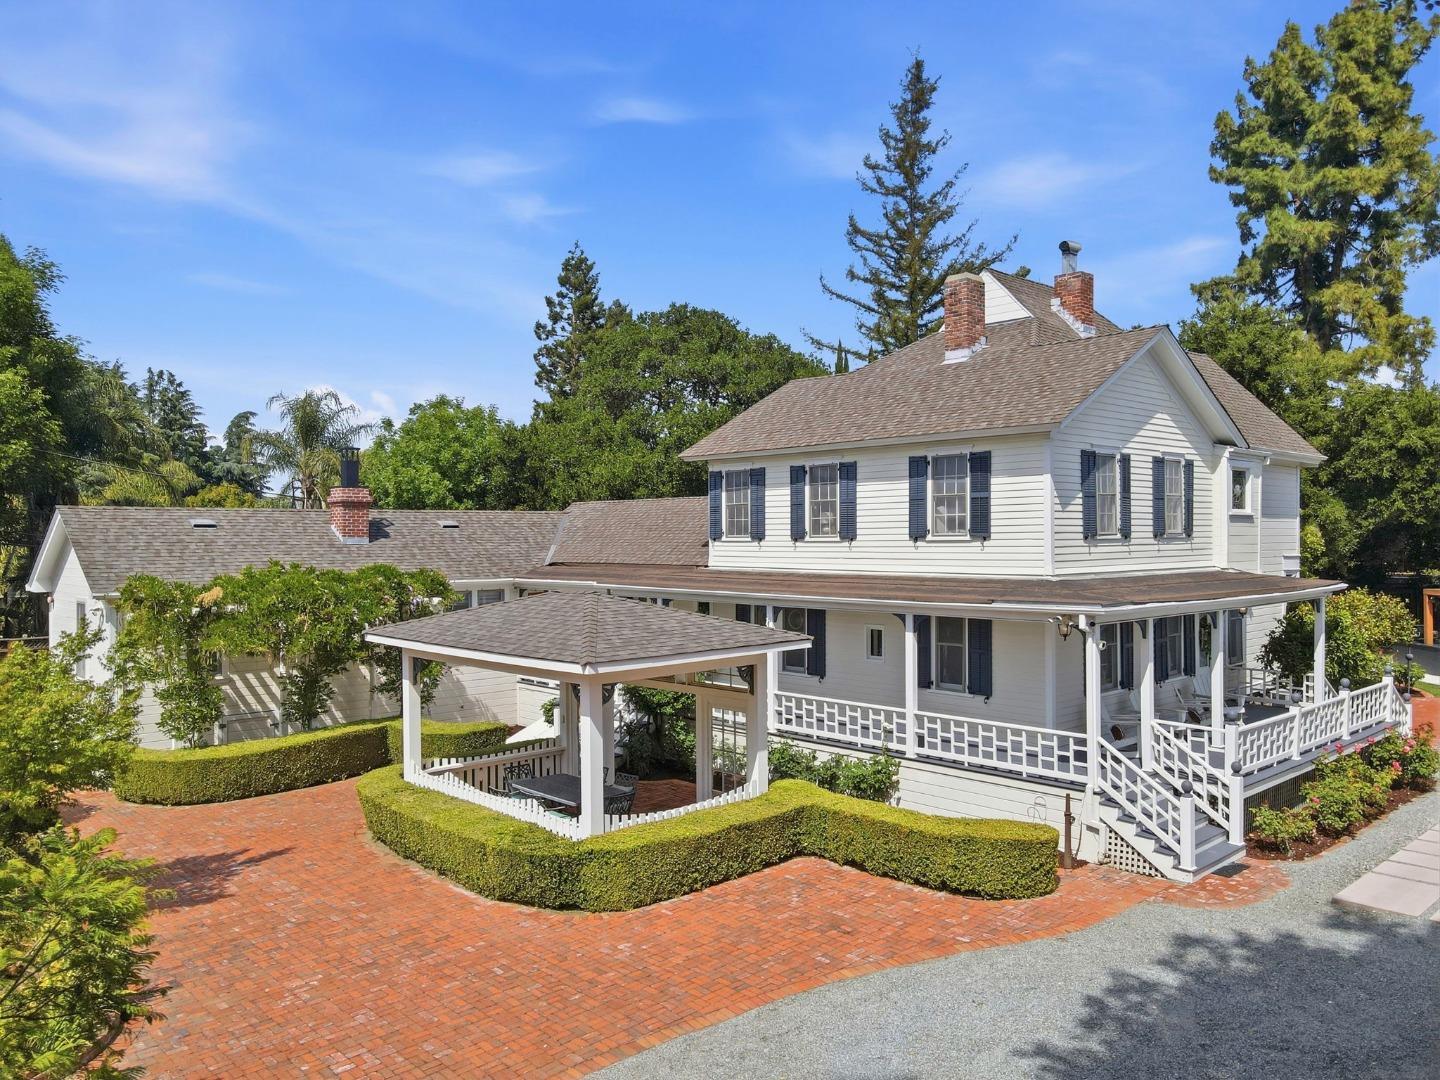
$5.7 million — and nothing in Campbell has touched it in two years
The number that opens this story is also the ceiling: $5,700,000. That is what 140 S Peter Drive recorded as sold for on September 1, 2026, making it the highest-priced transaction Campbell has logged in at least two years. The previous 24-month high was $4,560,000. This sale cleared it by 25 percent.
Of the 286 sales in the dataset used for comparison, not one sits above it.
| Address | 140 S Peter Drive, Campbell |
|---|---|
| MLS | ML82045801 |
| Recorded as sold | September 1, 2026 |
| Sale price | $5,700,000 |
| Square footage | 4,012 sq ft |
| Price per sq ft | $1,421 |
| Lot size | 35,616 sq ft |
| Beds | 4 |
The lot is the detail that separates this property from every comp in the table below. At 35,616 square feet, it is more than three times the median lot size recorded across Campbell's last 180 days of sales (6,464 sq ft), and roughly three to four times the lot sizes carried by the comparable sales in its size band.
Where $5.7 million sits in Campbell's market
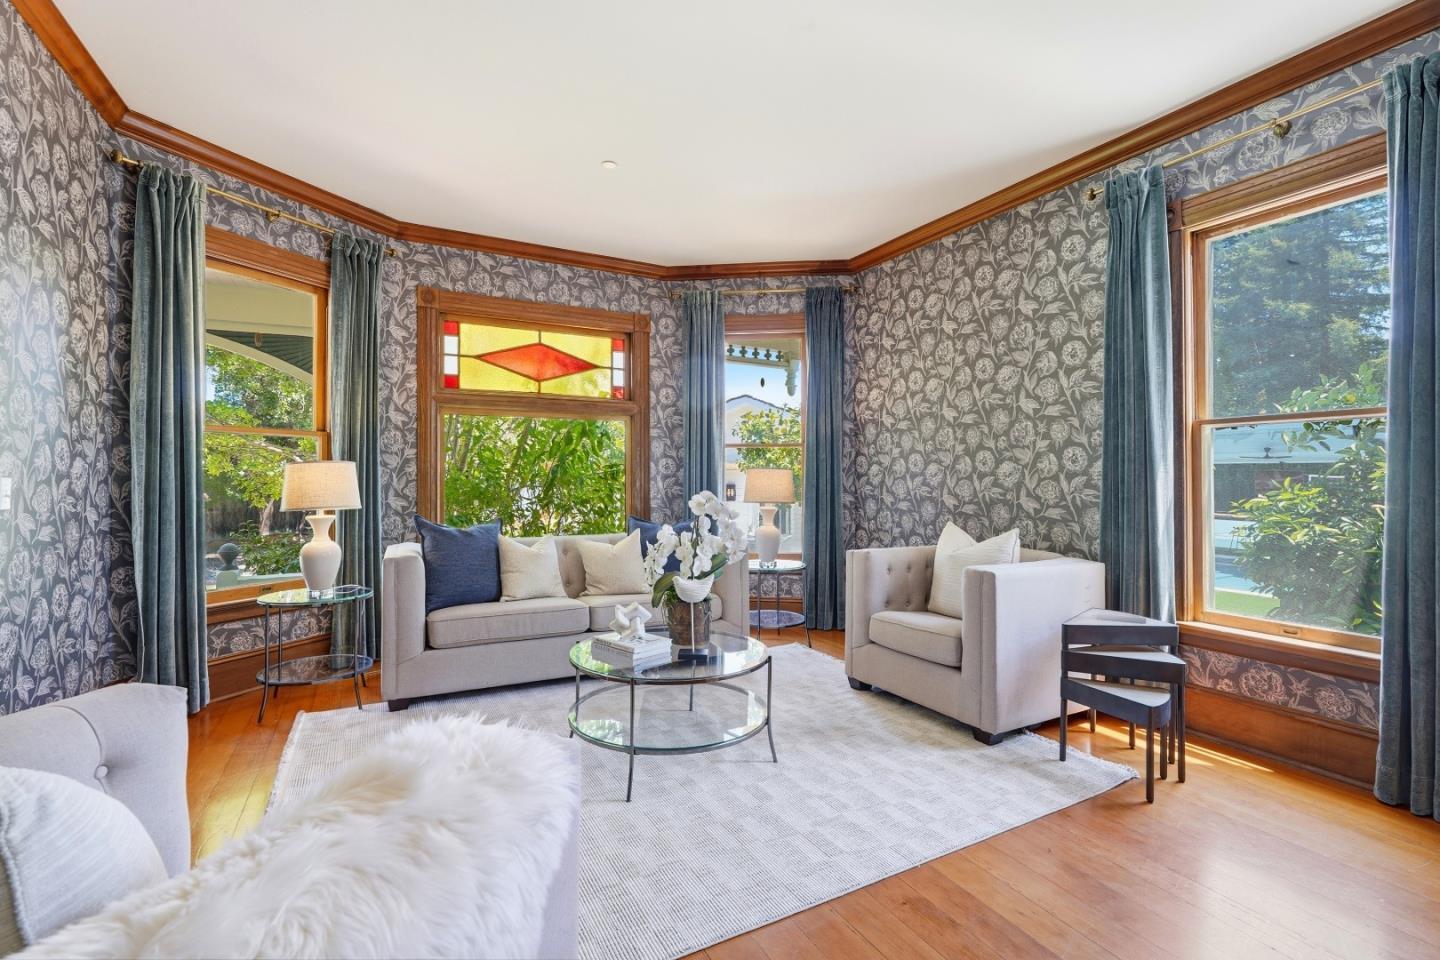
The city's current market median is $1,919,000, based on 148 sales recorded in the last 180 days. The S Peter Drive sale is 2.97 times that median — call it three times the going rate for a Campbell home.
On a per-foot basis, the gap narrows but does not close. The subject's $1,421 per square foot is 39 percent above the citywide median of $1,020 per square foot. It is also 25 percent above the median per-foot figure for its own size band — homes between 3,210 and 4,814 square feet, where 11 sales have traded at a median of $1,135 per square foot and a median price of $4,150,000.
That per-foot premium over its size-band peers is where the story gets specific. The six comps in the table below — all within 25 percent of the subject's square footage — topped out at $1,212 per square foot. S Peter Drive ran $209 per foot above that ceiling.
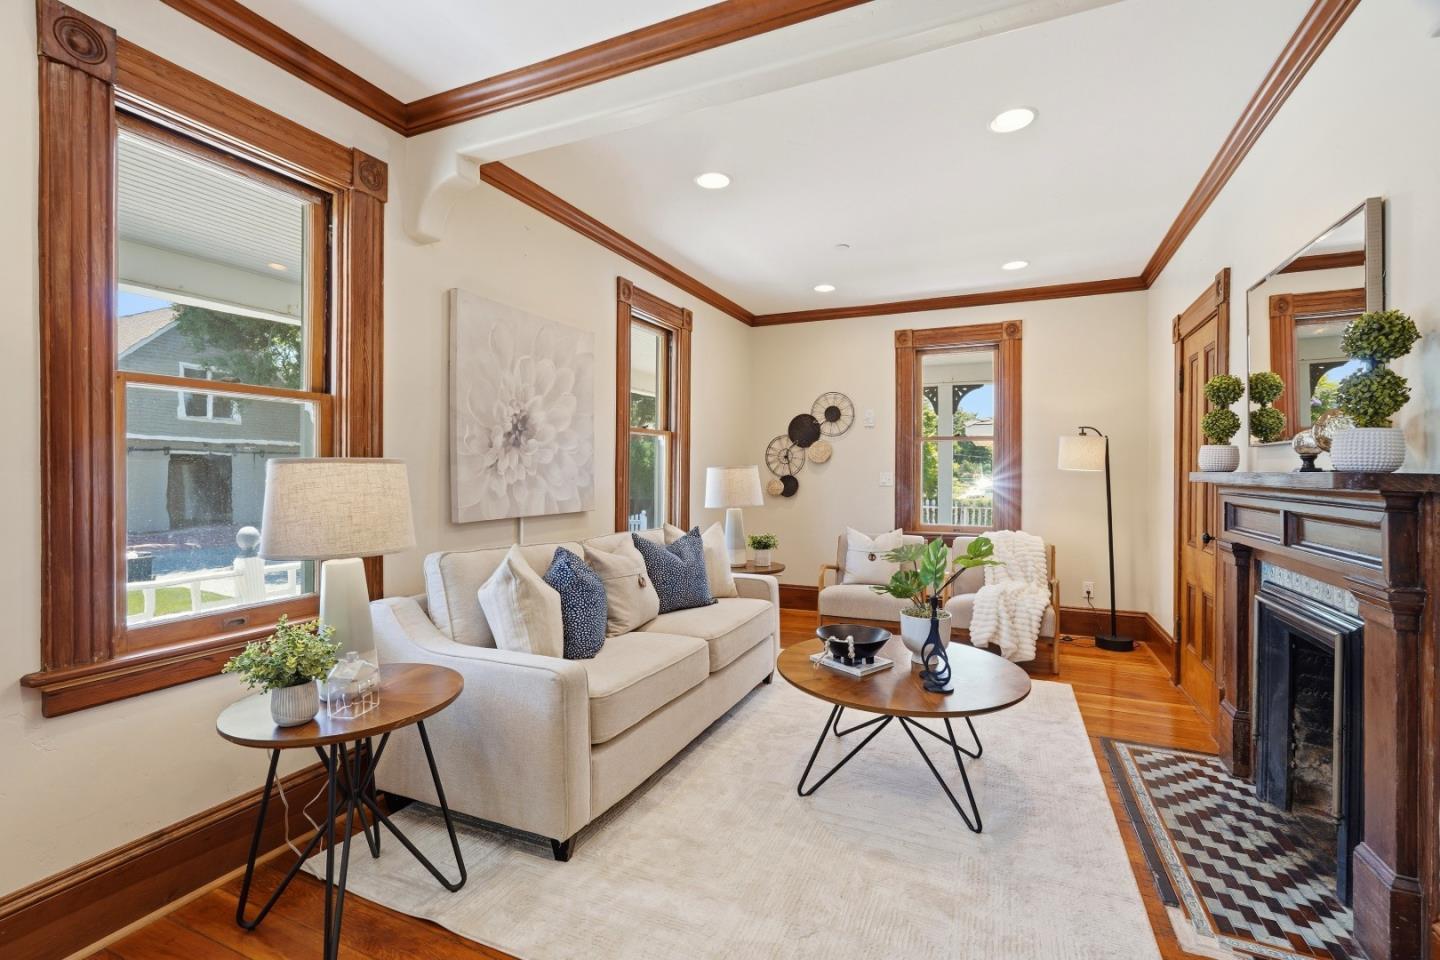
One number worth noting in the year-over-year read: the citywide median price rose from $1,830,000 to $1,919,000, a gain of roughly five percent. But the median price per foot moved in the opposite direction, from $1,085 to $1,020 — a six percent decline. When prices rise while per-foot values fall, larger homes are doing more of the lifting. This sale is the logical endpoint of that trend.
Recent comparable sales
| Address | Recorded | Price | Sq ft | $/sq ft |
|---|---|---|---|---|
| 104 Hardy Avenue | Sep 1, 2026 | $3,650,000 | 3,318 | $1,100 |
| 13 Virginia Avenue | Jun 18, 2026 | $4,000,000 | 4,130 | $969 |
| 136 Catalpa Lane | Apr 20, 2026 | $4,150,000 | 3,839 | $1,081 |
| 810 Virginia Court | Apr 17, 2026 | $3,850,000 | 3,249 | $1,185 |
| 401 Dallas Drive | Apr 17, 2026 | $4,200,000 | 3,466 | $1,212 |
| 384 Pamlar Avenue | Apr 11, 2026 | $3,250,000 | 3,181 | $1,022 |
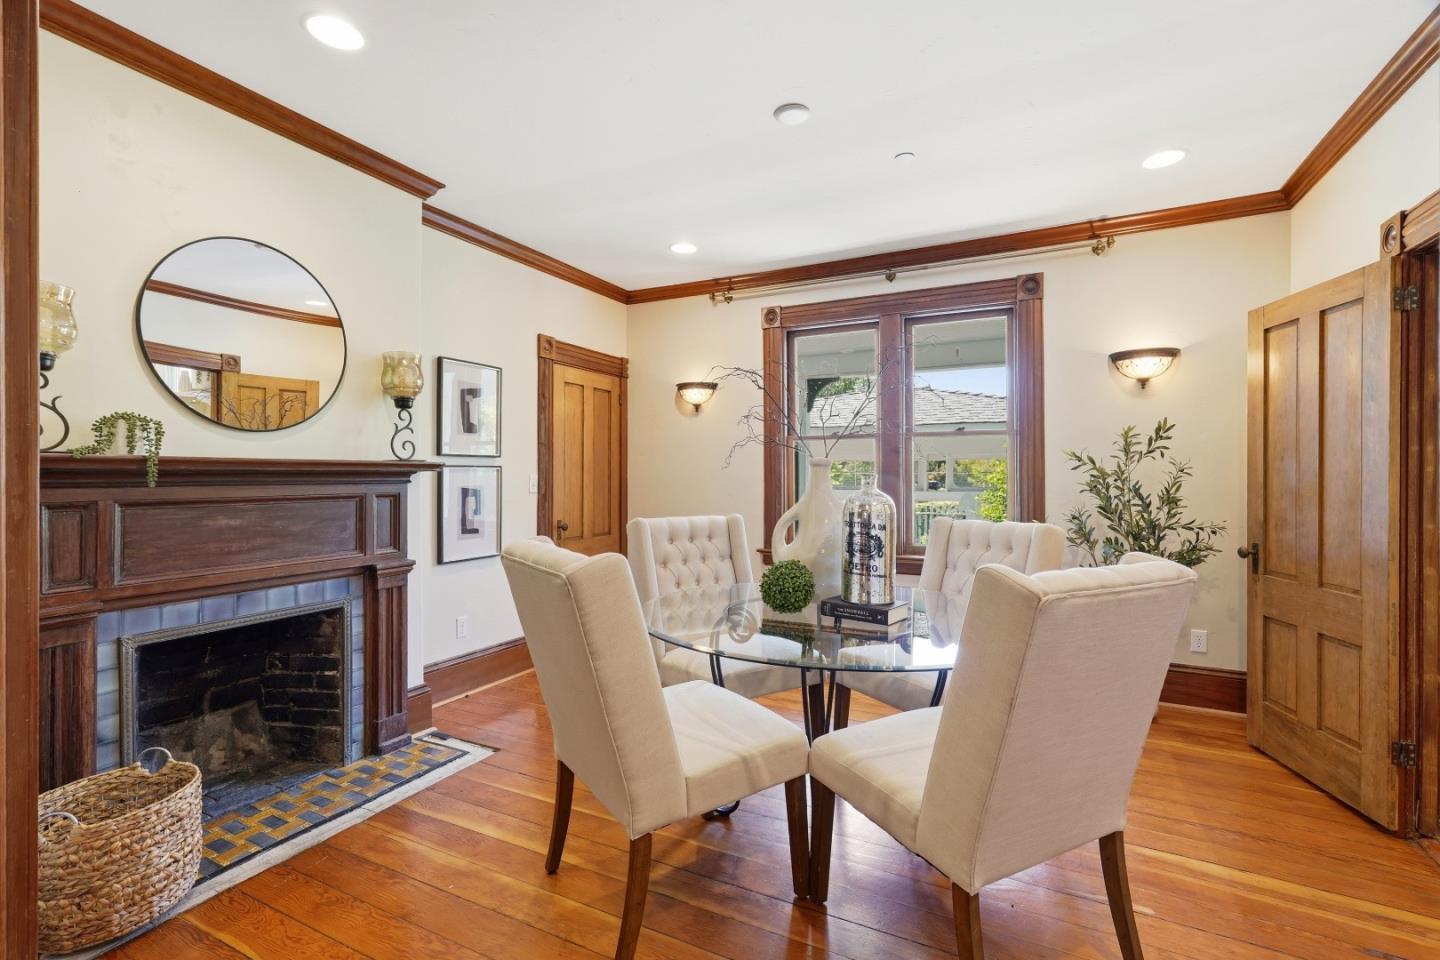
Date basis varies by row: 104 Hardy Avenue reflects MLS status change; all others reflect MLS close date.
Every comp in this table traded in a $950,000 range between $3,250,000 and $4,200,000 — and then S Peter Drive recorded $1,500,000 above the top of that cluster.
What this means depending on where you stand
If you are a buyer in Campbell's large-home segment, this sale resets your reference point. The comp table shows a market that had been pricing 3,200-to-4,800-square-foot homes between roughly $3.25 million and $4.2 million. A transaction at $5.7 million — with a lot more than three times the median size — introduces a data point that brokers will cite but that reflects a specific land premium most comparable listings will not carry.
If you own a large home in Campbell, the directional signal is clear: the top of the market moved up by 25 percent relative to where it sat 24 months ago. Whether your property shares the characteristics that drove this particular premium is a different question.
If you are undecided about Campbell as a market, the year-over-year data gives you something concrete to chew on. Median prices are up five percent. Median price per square foot is down six percent. That spread means the market is not uniformly stronger — it is larger homes carrying a greater share of the appreciation, while smaller properties are absorbing more of the per-foot softness. A $5.7 million outlier at the top does not change that underlying dynamic.
Tim McMullen · Tim McMullen, Broker · CA DRE #02016832
[email protected] · (415) 691-9272
More from Campbell
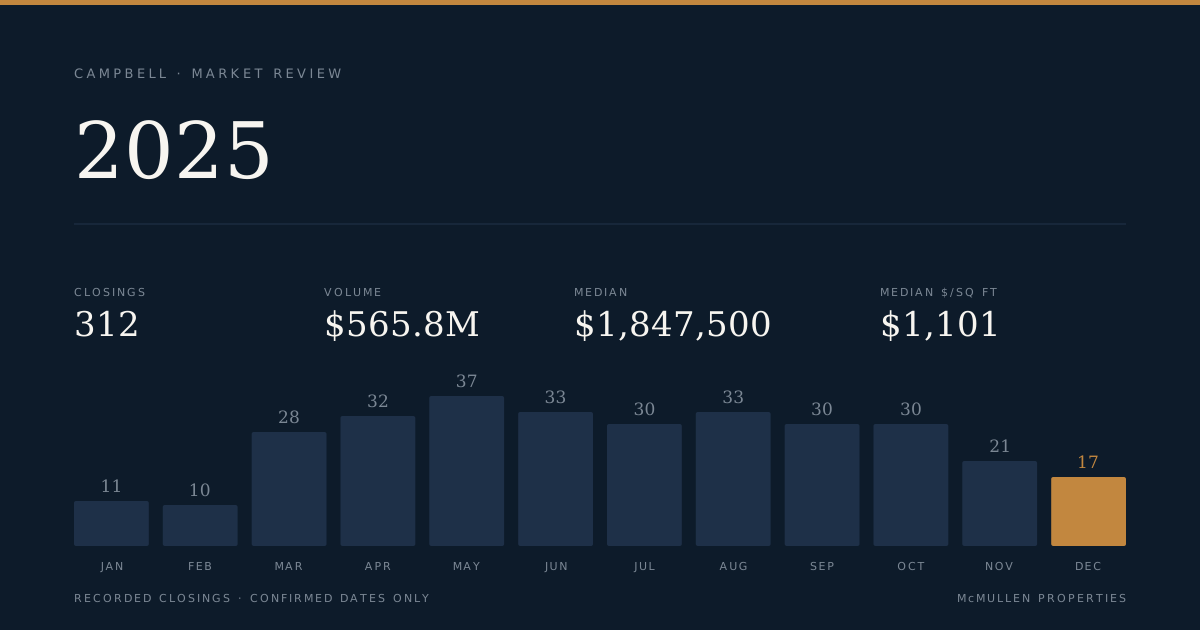
Campbell Records 312 Closings and $565.8M in Volume for 2025, With a $1.45M Spread Between Segments
All 312 closed sales across single-family, townhouse, and condominium segments are reflected in this report. The overall median landed at $1,847,500, while the single-family segment sat $1,443,056 above the condominium median.
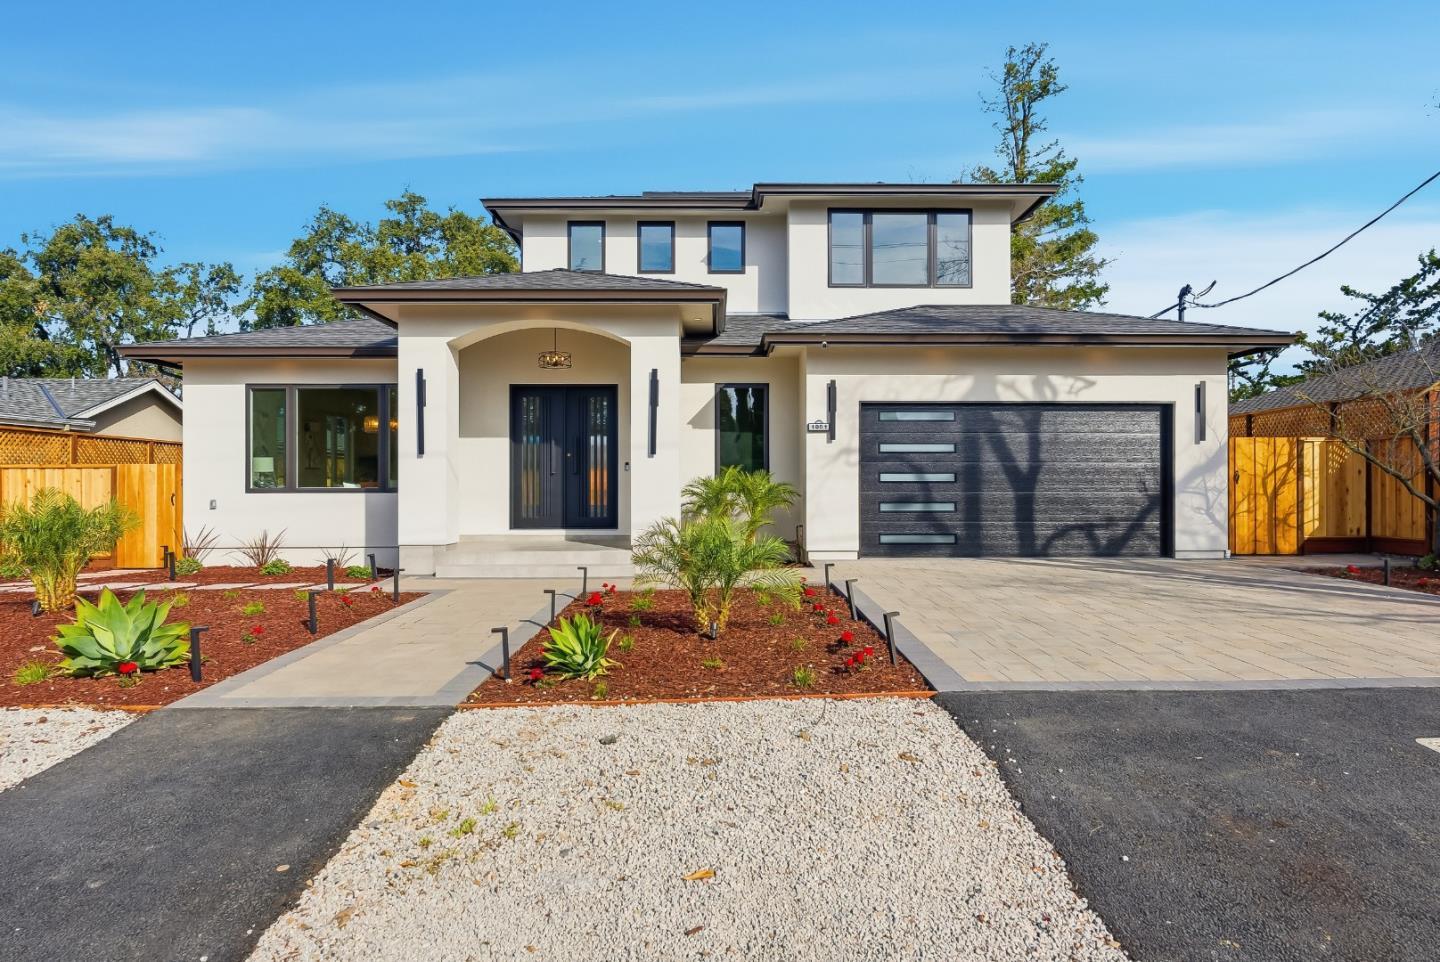
Campbell Q1 2026: 42 Closings, $76M in Volume, and a Median That Fell $408K in Three Months
Forty-two transactions closed across Campbell in Q1 2026, totaling $76.1 million. The overall median price began the quarter at $1,978,888 in January and ended at $1,570,000 in March — a 21 percent slide driven by a shift in the mix of what closed each month.
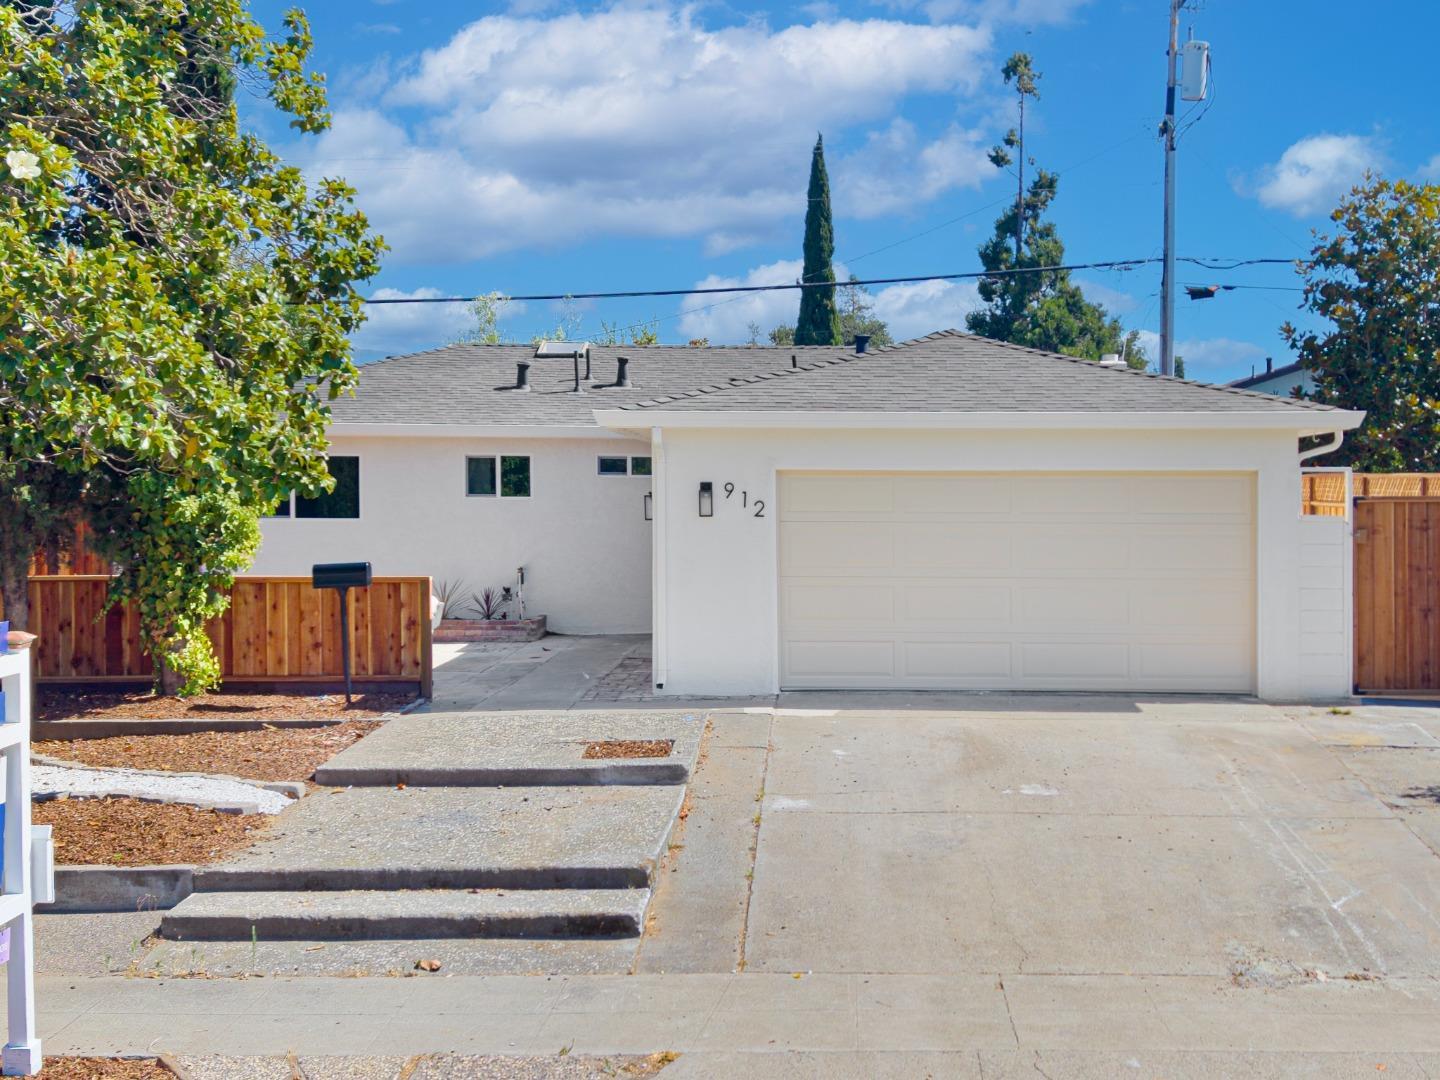
Back on the market 8 months after it last sold, 912 Connie Drive is asking $275,000 more
912 Connie Drive recorded as sold in January 2026 for $1,560,000. It hit the market again in August asking $1,835,000. The gap is $275,000 in 7.5 months.