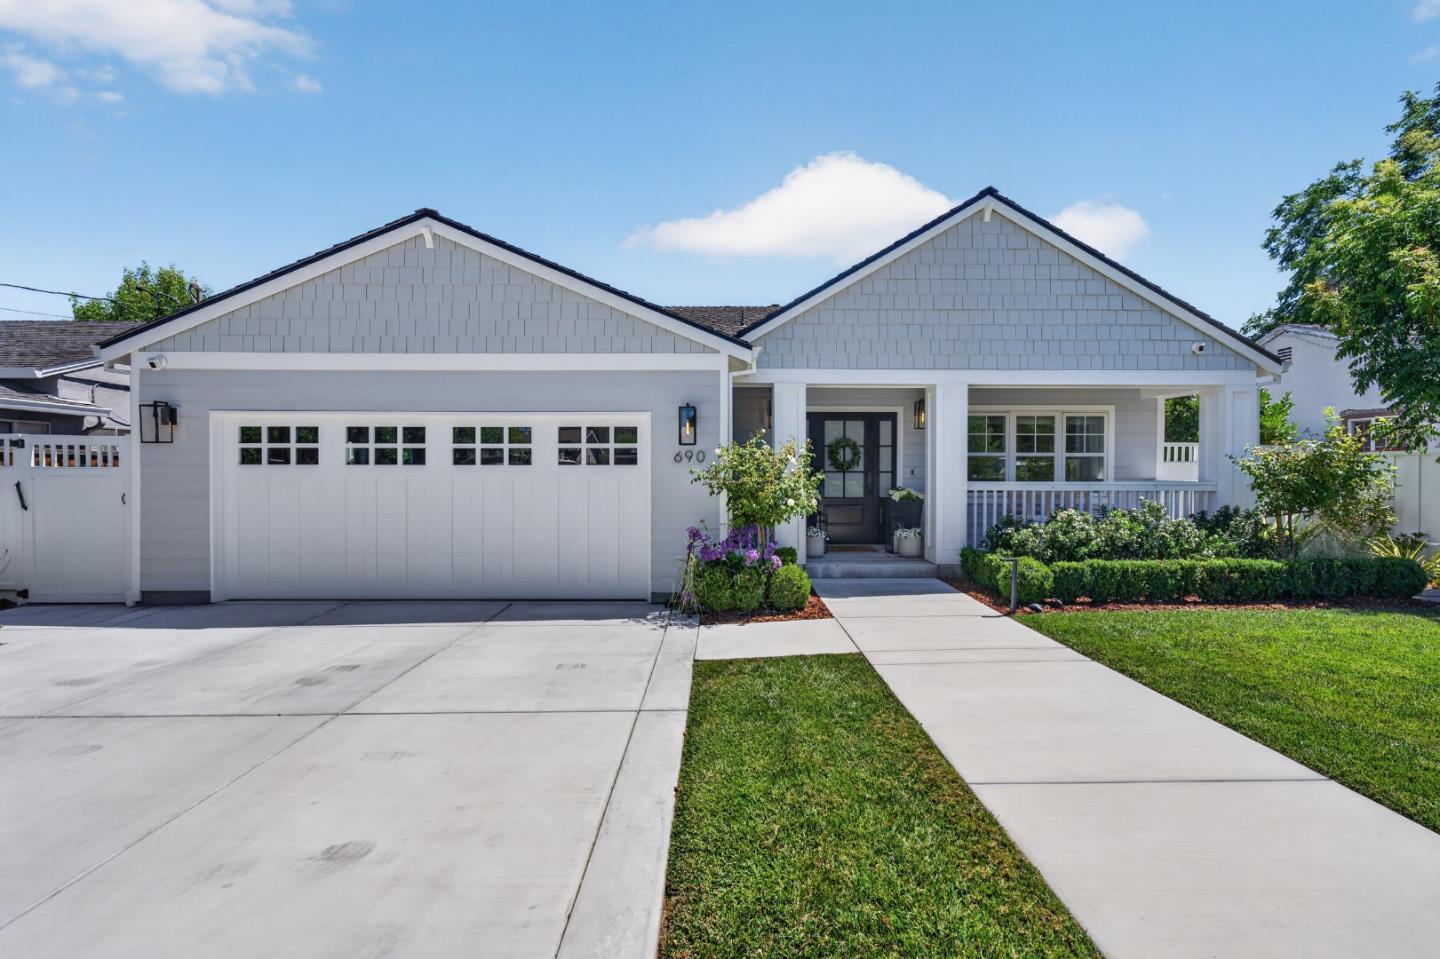
690 Elden Drive closes at $3.3 million, the highest recorded sale in Campbell's last 180 days
What changed in Campbell on September 18
690 Elden Drive recorded a sale price of $3,300,000 — the highest of the 148 sales recorded in Campbell over the last 180 days. It listed at $2,995,000. The final number landed $305,000 above asking, at $1,312 per square foot on 2,515 square feet.
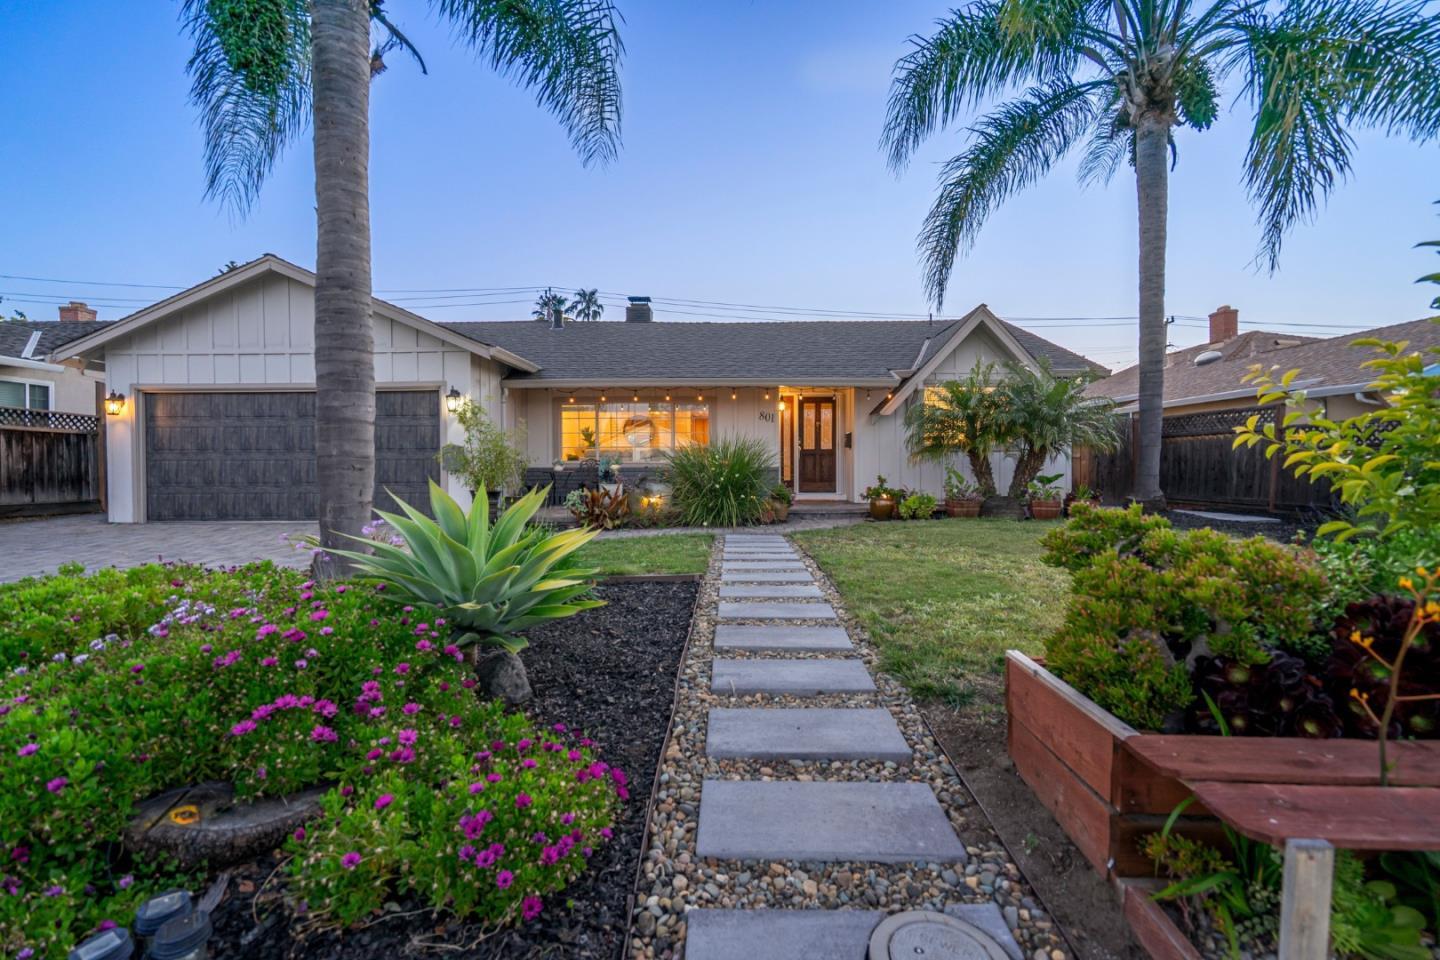
The same day, 801 Monica Lane recorded at $1,920,000, which is $78,000 below its $1,998,000 list price, at $934 per square foot on 2,056 square feet. Two closings, two opposite outcomes.
The two closings
| 690 Elden Drive | 801 Monica Lane | |
|---|---|---|
| Segment | Single Family | Single Family |
| List price | $2,995,000 | $1,998,000 |
| Sale price | $3,300,000 | $1,920,000 |
| Sq ft | 2,515 | 2,056 |
| $/sq ft | $1,312 | $934 |
| vs. list | +$305,000 | −$78,000 |
Where these land in the market
Across 148 Campbell sales in the last 180 days, the median price is $1,919,000 and the median price per square foot is $1,020. The year-ago median, over the same 180-day window in the prior year, was $1,837,500 at $1,090 per square foot.
That comparison tells the story plainly: the median sale price is up about 4.4 percent year over year, while the median price per square foot is down about 6.4 percent. Price and price-per-foot moved in opposite directions. What that usually signals is a shift in the mix of what's selling — larger homes transacting this year relative to last, which pulls the per-foot figure down even as aggregate prices rise.
690 Elden Drive, at $3,300,000, is 1.72 times the current 180-day median. Its $1,312 per square foot is 29 percent above the $1,020 median per square foot for the same period, and it stands as the top recorded sale of the 148. That is not a one-off — 905 Sheila Court recorded at $1,471 per square foot in early September, so the upper range of the market has shown multiple data points above $1,300 per foot recently. 690 Elden Drive is the top of a trend, not an outlier.
801 Monica Lane, at $1,920,000, sits almost exactly at the market median — $1,000 above it. Its $934 per square foot is 8.4 percent below the median per-foot figure. A home that closes at median price but below median per-foot is typically larger than what's been moving; at 2,056 square feet against the market's median 1,692 square feet, that tracks.
Recent comparable sales
| Address | Recorded | Price | Sq ft | $/sq ft |
|---|---|---|---|---|
| 188 Harrison Avenue | 2026-09-09 | $1,650,000 | 1,733 | $952 |
| 1346 El Moro Drive | 2026-09-09 | $2,700,000 | 2,454 | $1,100 |
| 279 Wagon Way #34-03 | 2026-09-06 | $1,401,933 | 1,678 | $835 |
| 905 Sheila Court | 2026-09-05 | $1,950,000 | 1,326 | $1,471 |
| 287 Watson Drive #2 | 2026-09-05 | $555,000 | 903 | $615 |
| 122 Sunnyside Court | 2026-09-04 | $2,610,000 | 2,996 | $871 |
The six most recent comps span $835 to $1,471 per square foot — a 76 percent spread — which confirms that size alone does not set the per-foot rate; location and condition are doing heavy lifting at both ends.
Three new listings
Three single-family and townhouse properties appeared on the MLS feed on September 18.
- 1371 Juanita Way — Single Family — $3,680,000
- 425 Sunberry Drive — Single Family — $1,679,000
- 136 Redding Road — Townhouse — $1,495,000
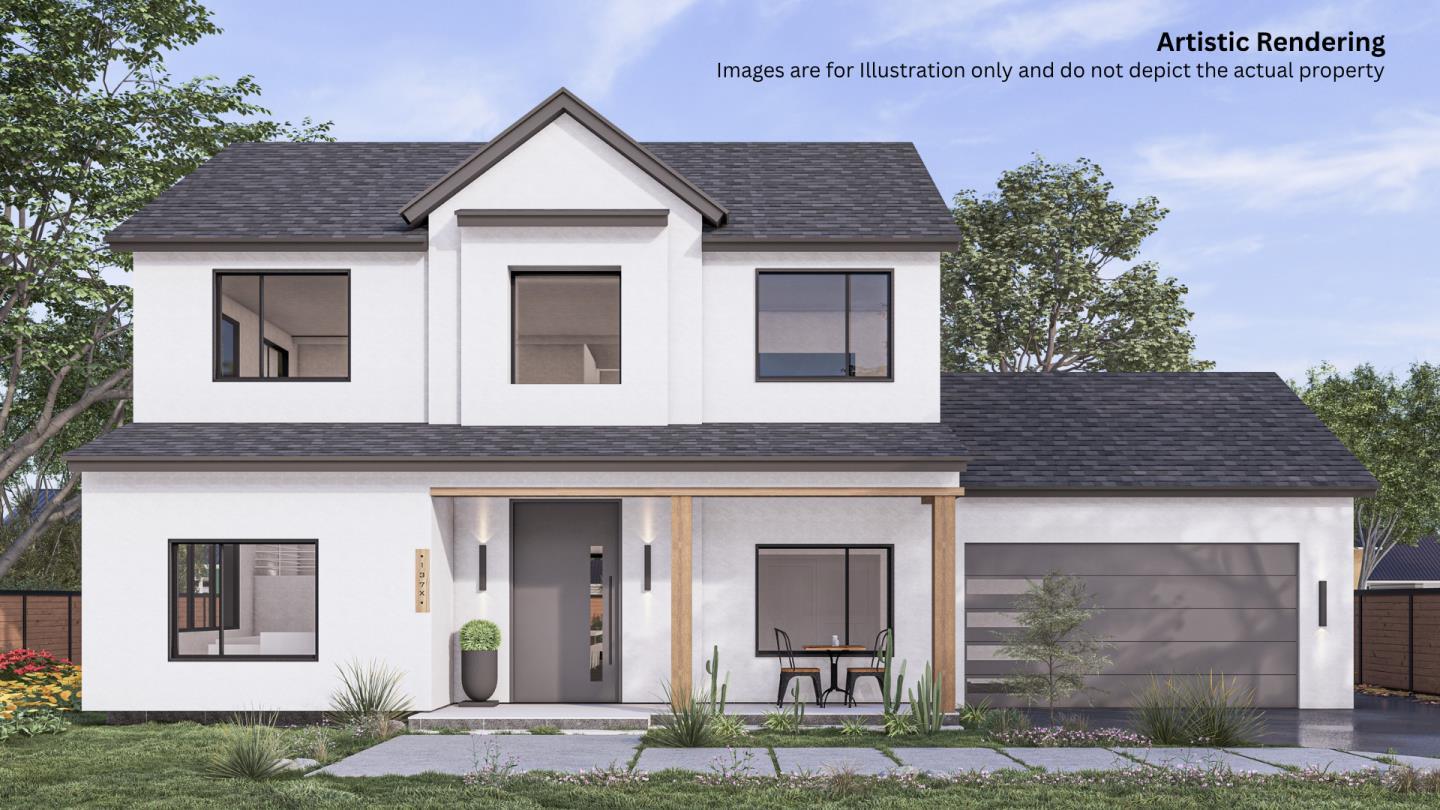
1371 Juanita Way lists at $3,680,000, which is $380,000 above the closing price 690 Elden Drive just set. Whether the market confirms that ask is a question September will answer. 425 Sunberry Drive at $1,679,000 and 136 Redding Road at $1,495,000 both sit below the current 180-day median of $1,919,000 for single-family sales — entry-level positioning by Campbell standards.
No properties went pending on September 18.
What it means
For a buyer, the gap between 690 Elden Drive and 801 Monica Lane shows that the premium end is still moving above ask while even well-priced mid-market homes are not immune to finishing below list. Knowing which dynamic applies to any specific home requires reading the per-foot number against recent comps, not just the list price.
For an owner, the year-over-year picture is mixed. Median prices are up 4.4 percent, but per-foot values are down 6.4 percent. If you own a smaller home, the per-foot decline is worth watching. If you own something above 2,000 square feet, the price appreciation in that size range appears intact based on what closed this week.
For someone undecided, the new inventory at 1371 Juanita Way priced above the day's top closing is a data point: sellers at the top of the market are still testing. How quickly that listing moves — or doesn't — will say more about where Campbell's ceiling sits than any single closing can.
Tim McMullen · Tim McMullen, Broker · CA DRE #02016832
[email protected] · (415) 691-9272
More from Campbell
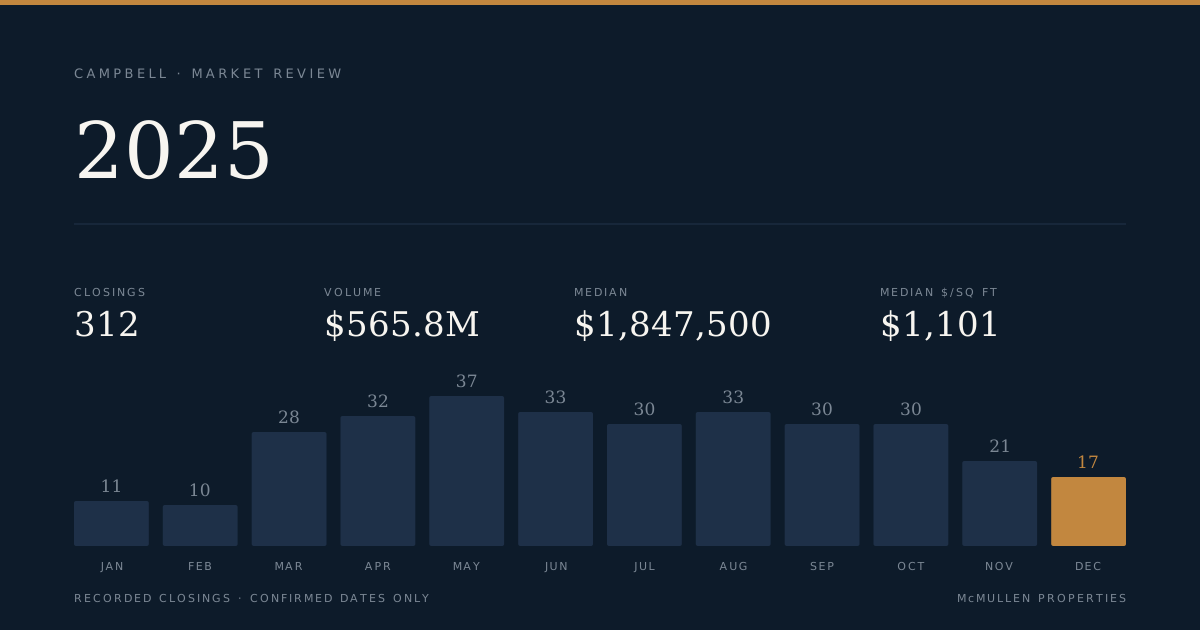
Campbell Records 312 Closings and $565.8M in Volume for 2025, With a $1.45M Spread Between Segments
All 312 closed sales across single-family, townhouse, and condominium segments are reflected in this report. The overall median landed at $1,847,500, while the single-family segment sat $1,443,056 above the condominium median.
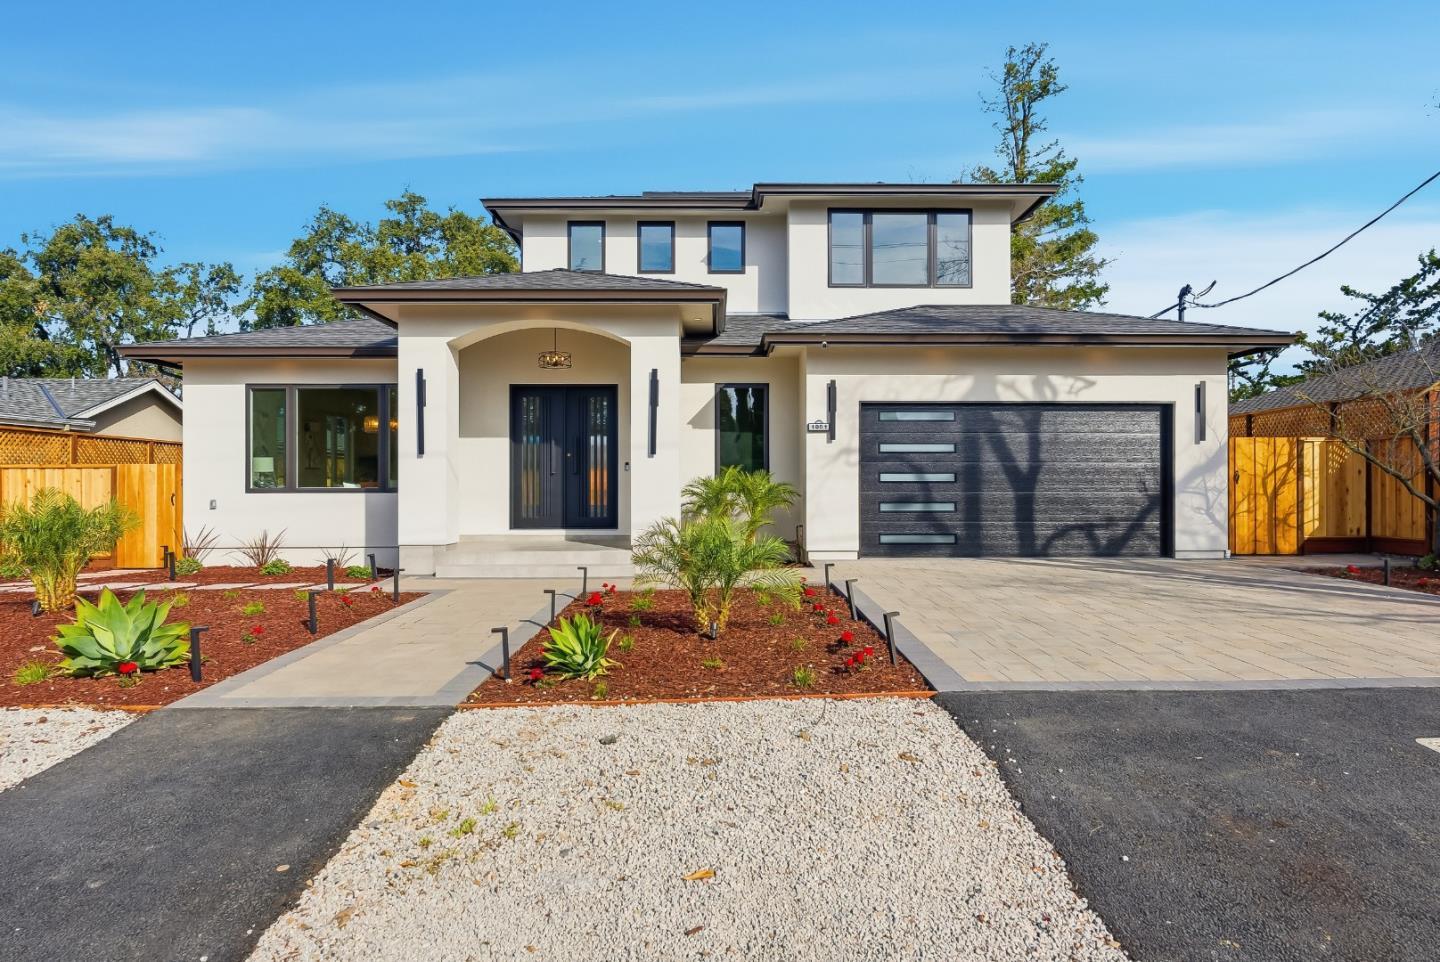
Campbell Q1 2026: 42 Closings, $76M in Volume, and a Median That Fell $408K in Three Months
Forty-two transactions closed across Campbell in Q1 2026, totaling $76.1 million. The overall median price began the quarter at $1,978,888 in January and ended at $1,570,000 in March — a 21 percent slide driven by a shift in the mix of what closed each month.
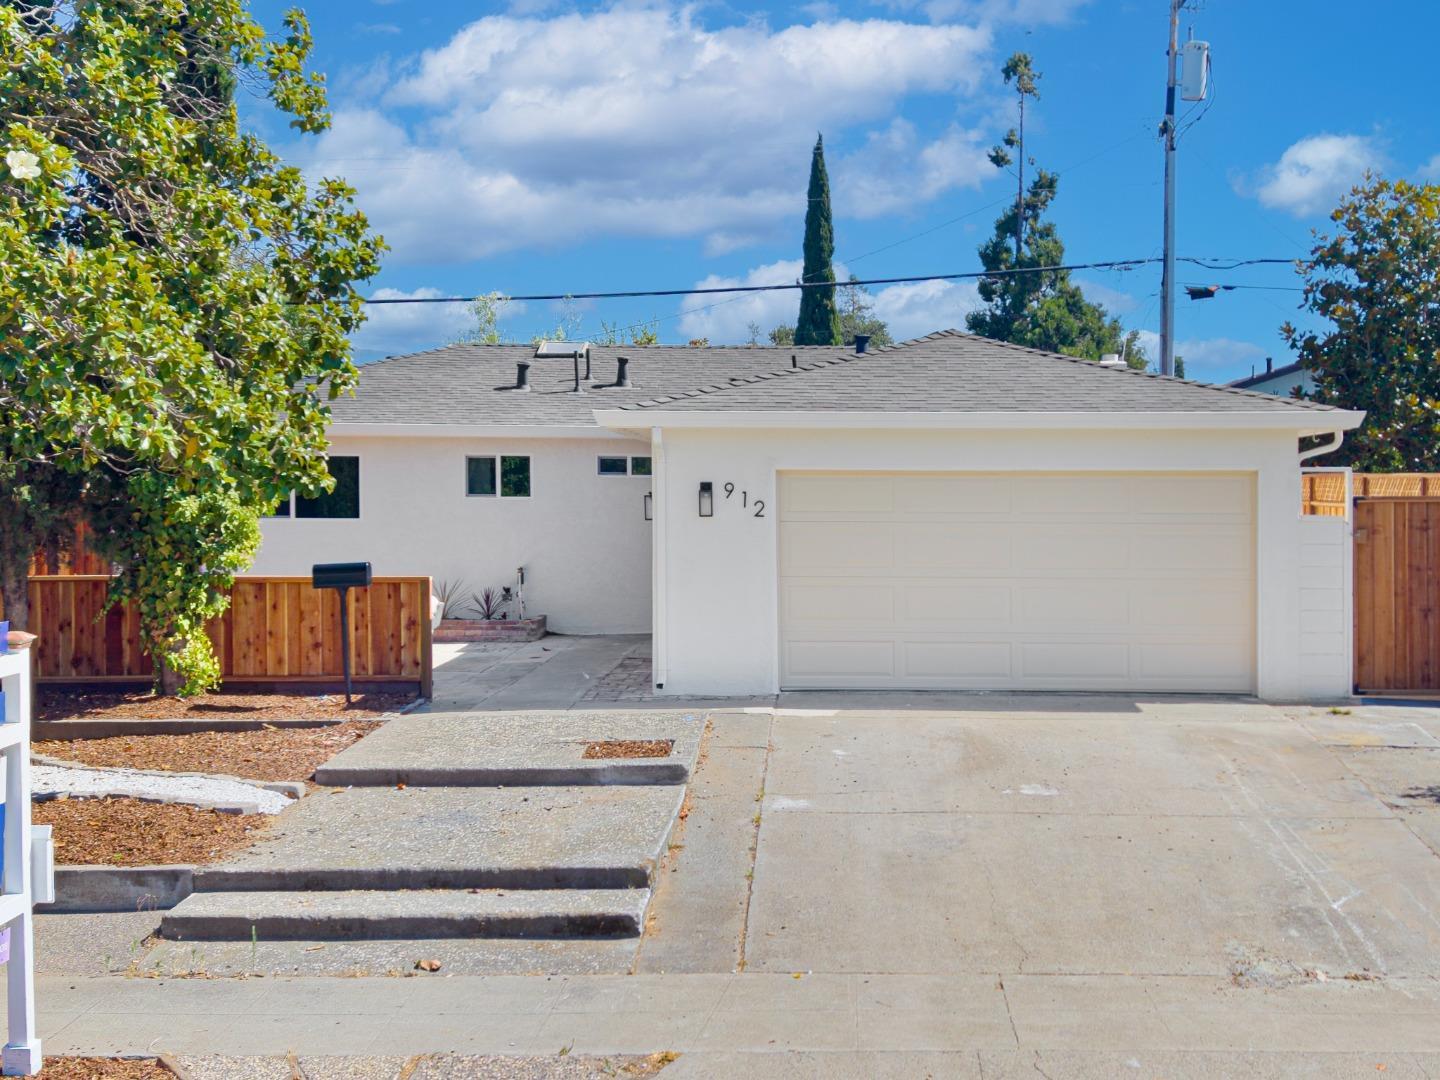
Back on the market 8 months after it last sold, 912 Connie Drive is asking $275,000 more
912 Connie Drive recorded as sold in January 2026 for $1,560,000. It hit the market again in August asking $1,835,000. The gap is $275,000 in 7.5 months.