Campbell March 2026 Market Report
# March 2026 in Campbell: 19 of 27 sales closed above asking price
Seven homes sold under list. Nineteen sold over. That split is the clearest thing about March in Campbell — and the spread between the two extremes was wide.
The numbers
| Metric | March 2026 |
|---|---|
| Closings | 27 |
| Median sale price | $1,835,000 |
| Median price per sq ft | $1,052 |
| Median days on market | 8 |
| Median sale-to-list ratio | 102.3% |
| Sales over list | 19 |
| Sales under list | 7 |
| Top sale | $4,560,000 — 1001 Audrey Ave |
What sold
Single-family homes carried the month. Seventeen closed, ranging from $1,380,000 to $4,560,000, with a median of $2,169,375. At $1,207 per square foot and a median of eight days on market, these moved fast and commanded price. That eight-day figure is the same as the overall market median, which makes sense given single-family homes made up 63% of closings.
Townhouses had six sales, running from $938,000 to $1,860,000. With only six transactions, the sample is too small to report a median — but the $922,000 spread between the low and high end signals a genuinely varied set of properties, not a tidy cluster.
Condominiums had four sales, from $590,000 to $1,207,000. Same story: too few for a reliable median. The range is meaningful on its own. If you're oriented toward the lower end of Campbell's market, the condo segment is where sub-$1M entry points still existed in March.
What moved the median
The overall median came in at $1,835,000. The mix — 63% single-family homes — did not shift materially enough to drive that number on its own. This wasn't a case of the composition changing and the median following. The single-family segment's median of $2,169,375 versus the condo floor of $590,000 shows how much range sits inside that overall figure. Take it as a market-wide reference point, not a price for any particular property type.
The one to notice
Listed at $1,999,888, 2283 Lemoyne Way closed at $2,555,000 — 27.8% above asking, the widest gap of the month by percentage. That's a $555,112 difference between list and close, not a rounding error. For context, the overall median sale-to-list ratio was 102.3%, meaning most overbids were measured — a few points here and there. Lemoyne Way landed at a completely different magnitude. One sale is one sale, and the block doesn't tell us the property details behind the number. But 27.8% over list in a month where seven homes sold under asking stands on its own as the sharpest single data point March produced.
On the other end of the ledger: 908 Marilyn Drive listed at $1,898,000 and closed at $1,835,000, a 3.3% reduction — the deepest cut of the month. That $63,000 gap is the outer boundary of what sellers gave back in March. It also happens to be exactly the overall median sale price, which is a coincidence the numbers produce, not a conclusion to draw from it.
The top sale by price was 1001 Audrey Avenue at $4,560,000 — 4,018 square feet, 19 days on market, and comfortably above anything else that closed in March. At roughly $1,135 per square foot it came in below the single-family segment's median price per square foot of $1,207, which reflects size: larger homes tend to price differently on a per-foot basis.
Twenty-seven closings. Eight median days on market. A 27.8% overbid sitting next to a 3.3% reduction. That's March in Campbell.
Every recorded sale this month
All 27 closings, in order of price. Each address links to its full record.
| Address | Type | Bd/Ba | Sq ft | List | Sold | % of list | DOM | Closed |
|---|---|---|---|---|---|---|---|---|
| 1001 Audrey Avenue | Single Family | 6/5.5 | 4,018 | $4,690,000 | $4,560,000 | 97.2% | 19 | Mar 9 |
| 341 Carlyn Avenue | Single Family | 4/4.5 | 3,538 | $3,899,999 | $3,943,000 | 101.1% | 7 | Mar 19 |
| 1380 Ridgeley Drive | Single Family | 4/3.5 | 2,319 | $2,699,000 | $2,800,000 | 103.7% | 4 | Mar 27 |
| 295 Beverly Court | Single Family | 4/2.5 | 1,946 | $2,799,950 | $2,800,000 | 100.0% | 11 | Mar 26 |
| 1285 Capri Drive | Single Family | 2/1 | 1,100 | $2,750,000 | $2,780,000 | 101.1% | 0 | Mar 30 |
| 2283 Lemoyne Way | Single Family | 4/2.5 | 1,935 | $1,999,888 | $2,555,000 | 127.8% | 7 | Mar 4 |
| 4029 Sadie Court | Single Family | 4/2 | 2,036 | $2,198,000 | $2,280,000 | 103.7% | 7 | Mar 6 |
| 173 Branbury Drive | Single Family | 3/2.5 | 1,470 | $1,899,000 | $2,200,000 | 115.9% | 9 | Mar 3 |
| 2330 Maximilian Drive | Single Family | 3/2 | 1,540 | $1,899,000 | $2,169,375 | 114.2% | 8 | Mar 4 |
| 872 Loyalton Drive | Single Family | 3/2 | 1,435 | $1,890,000 | $2,050,000 | 108.5% | 60 | Mar 30 |
| 1115 Holmes Avenue | Single Family | 3/2 | 1,191 | $1,799,000 | $1,900,000 | 105.6% | 7 | Mar 24 |
| 2207 Vizcaya Circle | Townhouse | 3/2.5 | 2,396 | $1,749,000 | $1,860,000 | 106.3% | 14 | Mar 5 |
| 1054 Steinway Avenue | Single Family | 3/2 | 1,326 | $1,650,000 | $1,850,000 | 112.1% | 2 | Mar 5 |
| 908 Marilyn Drive | Single Family | 4/2 | 1,744 | $1,898,000 | $1,835,000 | 96.7% | 83 | Mar 12 |
| 2261 Central Park Drive | Single Family | 4/2 | 1,687 | $1,688,000 | $1,750,000 | 103.7% | 7 | Mar 19 |
| 425 Queens Court | Single Family | 4/2 | 1,507 | $1,750,000 | $1,710,000 | 97.7% | 8 | Mar 16 |
| 1526 Redding Park Lane | Townhouse | 3/2.5 | 1,806 | $1,498,000 | $1,585,000 | 105.8% | 8 | Mar 30 |
| 206 Sunnyside Avenue | Single Family | 4/2.5 | 1,864 | $1,598,000 | $1,570,000 | 98.2% | 53 | Mar 26 |
| 402 Union Avenue #A | Townhouse | 3/2.5 | 1,683 | $1,399,000 | $1,430,000 | 102.2% | 9 | Mar 23 |
| 422 W Sunnyoaks Ave | Single Family | 3/3 | 1,766 | $1,399,000 | $1,380,000 | 98.6% | 15 | Mar 5 |
| 192 Shelley Avenue | Townhouse | 3/2.5 | 1,658 | $1,198,888 | $1,256,000 | 104.8% | 7 | Mar 18 |
| 722 Duncanville Court | Townhouse | 2/2.5 | 1,727 | $1,188,000 | $1,215,000 | 102.3% | 14 | Mar 10 |
| 492 W Hacienda Avenue | Condominium | 3/2.5 | 1,597 | $1,200,000 | $1,207,000 | 100.6% | 7 | Mar 13 |
| 87 Salice Way | Townhouse | 2/1.5 | 1,151 | $938,000 | $938,000 | 100.0% | 18 | Mar 27 |
| 47 Dot Avenue #D | Condominium | 2/2 | 1,442 | $799,000 | $865,000 | 108.3% | 8 | Mar 12 |
| 331 N 1St Street #3 | Condominium | 2/1 | 903 | $649,000 | $629,000 | 96.9% | 28 | Mar 17 |
| 848 Apricot Avenue #B | Condominium | 1/1 | 887 | $599,000 | $590,000 | 98.5% | 28 | Mar 24 |
---
Data sourced from recorded MLS closings, March 1–31, 2026. All figures are medians unless otherwise noted.
Source: MLSListings closed sales in Campbell, March 2026. 27 closings. Sale prices and closing dates are matters of public record. A summary of recorded sales is not an appraisal and is not an opinion of value on any specific home.
Tim McMullen · DRE #02016832 · How these numbers are put together
Press kit: figures & citation for this report →
More Campbell market reports
Campbell Q3 2026 Market Report
Campbell Posts $112.4M in Q3 2026 — 61 Closings, One Sale at $5.7M, Median Lands at $1.785M
Campbell September 2026 Market Report
208 Kamson Way closed 45% over ask — but Campbell's September median landed at $1,768,000 across 23 sales
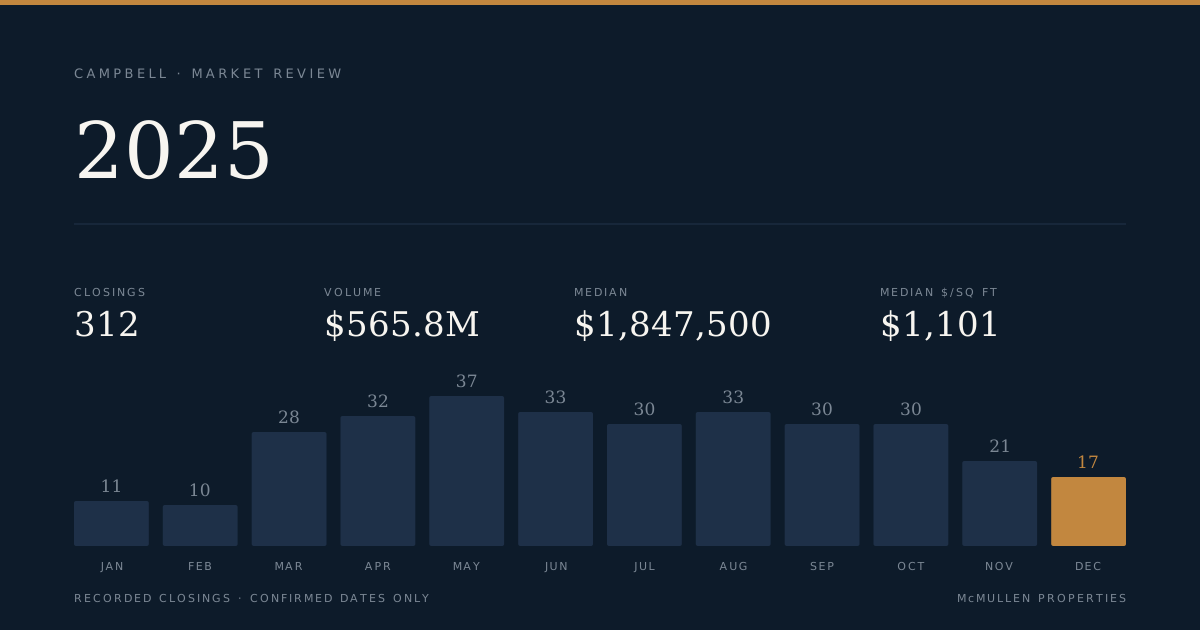
Campbell 2025 Market Report
Campbell Records 312 Closings and $565.8M in Volume for 2025, With a $1.45M Spread Between Segments