Campbell June 2026 Market Report
# June 2026 in Campbell: Single-family homes dominated the mix — and the median followed
Twenty-four closings. A split between buyers who paid over and buyers who paid under that was almost perfectly even. And one sale that blew past $4 million. June wasn't a quiet month — but the headline number needs a footnote before it means anything.
The numbers
| Metric | June 2026 |
|---|---|
| Closings | 24 |
| Median sale price | $1,690,000 |
| Median price per sq ft | $965 |
| Median days on market | 12 |
| Closed over list | 10 of 24 |
| Closed under list | 11 of 24 |
| Median sale-to-list | 100% |
What sold
Single-family homes carried the month. Sixteen of 24 closings — 67% of volume — were detached houses. They ranged from $1,150,000 to $4,000,000, with a median of $2,039,325, a median of $1,078 per square foot, and a median of 10 days on market. That's a fast, expensive segment, and it set the tone for every summary figure above.
Townhouses recorded seven closings, ranging from $850,000 to $1,430,000. Seven sales isn't enough to report a meaningful median, but that spread tells you something: the floor was $850K and the ceiling was $1.43M, which is a wide band for a single property type in one month. No median days on market or price-per-square-foot figure is available for this segment.
Condominiums had one closing: $688,888. One sale is a data point, not a market. That's where the segment summary ends.
What moved the median
The overall median of $1,690,000 needs context before anyone reads appreciation or depreciation into it. The mix shifted materially this month — single-family homes jumped from 52% of closings last month to 67% this month, a 15-percentage-point swing. Single-family homes are the most expensive segment in Campbell. When they account for two-thirds of volume, the overall median rises to reflect what's selling, not necessarily what the market is doing to prices.
Put plainly: a higher share of expensive homes sold. The median went up for that reason. The price-per-square-foot figure — $965 across all types — is a cleaner read on what the market actually paid per unit of space, and it gives you a more honest comparison point.
The over/under split reinforces the picture of a balanced month. Ten sales closed above list, eleven below, one right at. The median sale-to-list ratio landed at exactly 100%. That's not a euphemism — it's a month where the market, in aggregate, paid exactly what sellers asked. Nothing more, nothing less.
The one to notice
13 Virginia Avenue closed at $4,000,000. That's the top sale of the month, and it's not close — the next tier down is a different conversation entirely. The home is 4,130 square feet, which puts it at roughly $969 per square foot, right in line with the market-wide median. What's striking isn't the price per foot. It's the pace: 13 days on market. A $4 million house in Campbell found its buyer in under two weeks. That's not a distressed seller chasing the market down, and it's not a listing that sat while the price was negotiated into place. Someone wanted that house, and they moved.
The deepest cut this month was just as instructive in the other direction. 143 Kennedy Avenue listed at $1,626,875 and closed at $1,275,000 — a $351,875 reduction, or 21.6% below list. Whatever the reason — condition, location, an ambitious ask — the market said no at that price and kept saying no until the number came down substantially. That spread sits alongside the Virginia Avenue story as a reminder that June was not a market that moved in one direction. It moved in two, depending on the property.
The biggest overbid went to 229 W Rincon Avenue: listed at $2,300,000, closed at $2,500,000, an 8.7% premium. That's $200,000 over ask in a month where half the market paid at or below list. Someone wanted that one badly enough to make it count.
Every recorded sale this month
All 24 closings, in order of price. Each address links to its full record.
| Address | Type | Bd/Ba | Sq ft | List | Sold | % of list | DOM | Closed |
|---|---|---|---|---|---|---|---|---|
| 13 Virginia Avenue | Single Family | 5/6 | 4,130 | $3,988,810 | $4,000,000 | 100.3% | 13 | Jun 17 |
| 1185 Normandy Drive | Single Family | 4/3.5 | 2,490 | $2,748,000 | $2,876,000 | 104.7% | 6 | Jun 1 |
| 715 Cambrian Drive | Single Family | 4/2.5 | 1,525 | $2,998,888 | $2,800,000 | 93.4% | 10 | Jun 18 |
| 4083 Acapulco Drive | Single Family | 4/2.5 | 2,088 | $2,560,000 | $2,610,000 | 102.0% | 26 | Jun 22 |
| 229 W Rincon Avenue | Single Family | 4/2.5 | 2,174 | $2,300,000 | $2,500,000 | 108.7% | 1 | Jun 22 |
| 2740 Dresser Ct | Single Family | 4/2.5 | 2,469 | $2,349,888 | $2,280,000 | 97.0% | 11 | Jun 3 |
| 404 Shamrock Drive | Single Family | 4/3 | 2,344 | $2,299,999 | $2,256,000 | 98.1% | 76 | Jun 12 |
| 529 Plum Blossom Lane | Single Family | 4/2.5 | 2,069 | $2,080,800 | $2,080,650 | 100.0% | 2 | Jun 4 |
| 121 Victor Avenue | Single Family | 4/2 | 2,062 | $1,998,000 | $1,998,000 | 100.0% | 10 | Jun 22 |
| 640 Craig Avenue | Single Family | 4/2 | 1,676 | $1,788,888 | $1,935,000 | 108.2% | 0 | Jun 8 |
| 111 George Court | Single Family | 4/2.5 | 1,965 | $1,798,000 | $1,775,000 | 98.7% | 59 | Jun 16 |
| 407 Lawndale Avenue | Single Family | 3/2 | 1,421 | $1,788,880 | $1,700,000 | 95.0% | 12 | Jun 3 |
| 1130 Normandy Dr | Single Family | 2/1 | 1,235 | $1,590,000 | $1,680,000 | 105.7% | 3 | Jun 11 |
| 421 Manchester Avenue | Single Family | 3/1.5 | 1,641 | $1,499,000 | $1,601,400 | 106.8% | 6 | Jun 30 |
| 63 Braxton Terrace | Townhouse | 3/3.5 | 1,947 | $1,450,000 | $1,430,000 | 98.6% | 113 | Jun 5 |
| 143 Kennedy Avenue | Single Family | 3/2.5 | 1,676 | $1,626,875 | $1,275,000 | 78.4% | 112 | Jun 25 |
| 89 E Rincon Avenue | Single Family | 2/1 | 588 | $1,150,000 | $1,150,000 | 100.0% | 18 | Jun 1 |
| 84 Shelley Avenue | Townhouse | 3/2.5 | 1,390 | $1,148,000 | $1,100,000 | 95.8% | 21 | Jun 22 |
| 515 Union Avenue | Townhouse | 2/2.5 | 1,332 | $1,049,999 | $1,062,000 | 101.1% | 56 | Jun 18 |
| 137 Redding Road #B | Townhouse | 2/2.5 | 1,344 | $1,050,000 | $1,055,000 | 100.5% | 12 | Jun 2 |
| 199 Shelley Avenue | Townhouse | 2/2.5 | 1,280 | $999,888 | $965,000 | 96.5% | 48 | Jun 22 |
| 561 Merrimac Drive | Townhouse | 2/2.5 | 1,242 | $888,000 | $925,000 | 104.2% | 12 | Jun 5 |
| 116 Monte Villa Court | Townhouse | 2/2.5 | 1,302 | $899,000 | $850,000 | 94.5% | 69 | Jun 30 |
| 363 E Latimer Avenue #1 | Condominium | 2/1 | 810 | $688,888 | $688,888 | 100.0% | 21 | Jun 30 |
Source: MLSListings closed sales in Campbell, June 2026. 24 closings. Sale prices and closing dates are matters of public record. A summary of recorded sales is not an appraisal and is not an opinion of value on any specific home.
Tim McMullen · DRE #02016832 · How these numbers are put together
Press kit: figures & citation for this report →
More Campbell market reports
Campbell Q3 2026 Market Report
Campbell Posts $112.4M in Q3 2026 — 61 Closings, One Sale at $5.7M, Median Lands at $1.785M
Campbell September 2026 Market Report
208 Kamson Way closed 45% over ask — but Campbell's September median landed at $1,768,000 across 23 sales
Campbell 2025 Market Report
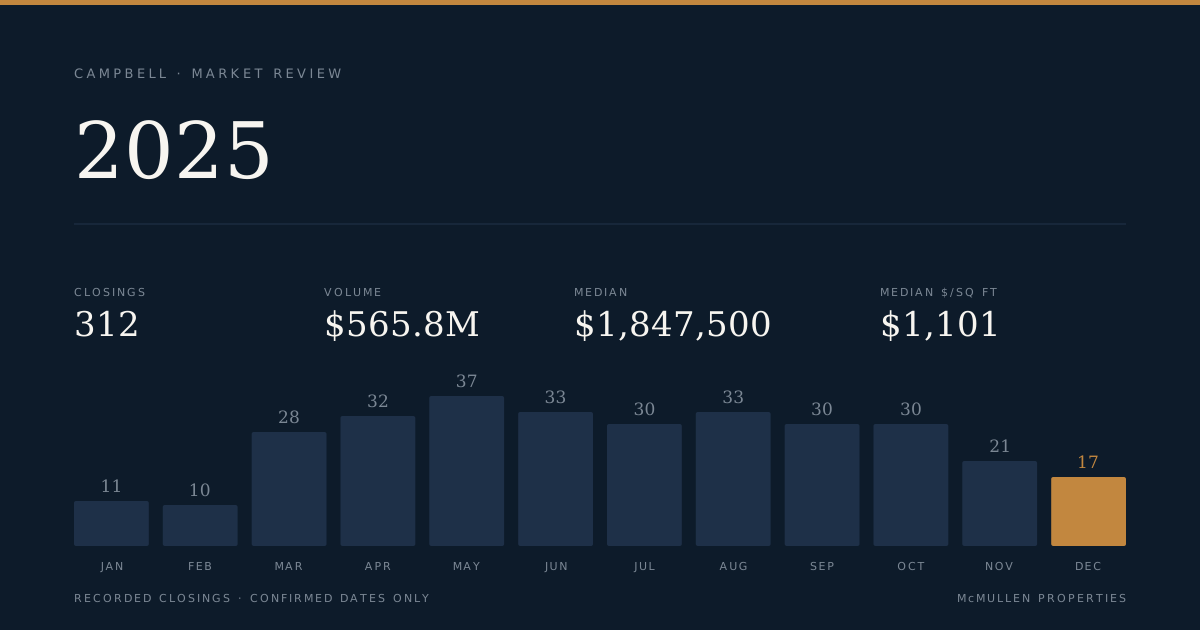
Campbell Records 312 Closings and $565.8M in Volume for 2025, With a $1.45M Spread Between Segments