Campbell April 2026 Market Report
# April 2026 in Campbell: Eighteen of Twenty-Nine Closed Above List
April was quick and competitive. Twenty-nine homes closed across all types, the median days on market was 11, and 18 of those 29 sales settled above the asking price. Seven closed below. That's a market that was neither uniformly on fire nor quietly cooling — it moved at different speeds for different properties.
Every recorded sale this month
All 29 closings, in order of price. Each address links to its full record.
| Address | Type | Bd/Ba | Sq ft | List | Sold | % of list | DOM | Closed |
|---|---|---|---|---|---|---|---|---|
| 401 Dallas Drive | Single Family | 5/3.5 | 3,466 | $4,288,000 | $4,200,000 | 97.9% | 15 | Apr 17 |
| 136 Catalpa Lane | Single Family | 5/4.5 | 3,839 | $4,150,000 | $4,150,000 | 100.0% | 0 | Apr 20 |
| 810 Virginia Court | Single Family | 5/4 | 3,249 | $4,070,000 | $3,850,000 | 94.6% | 15 | Apr 17 |
| 152 Bland Avenue | Single Family | 4/3.5 | 2,545 | $3,599,000 | $3,780,000 | 105.0% | 11 | Apr 28 |
| 384 Pamlar Avenue | Single Family | 3/3.5 | 3,181 | $3,250,000 | $3,250,000 | 100.0% | 0 | Apr 11 |
| 1644 Castro Drive | Single Family | 3/2.5 | 1,887 | $2,198,000 | $2,988,000 | 135.9% | 7 | Apr 27 |
| 1054 Longfellow Avenue | Single Family | 3/3.5 | 1,919 | $2,598,880 | $2,930,000 | 112.7% | 6 | Apr 17 |
| 1434 Capri Drive | Single Family | 3/2.5 | 2,166 | $2,350,000 | $2,710,000 | 115.3% | 7 | Apr 21 |
| 956 Norin Court | Single Family | 4/2.5 | 2,157 | $2,295,000 | $2,625,000 | 114.4% | 11 | Apr 1 |
| 803 W Sunnyoaks Avenue | Single Family | 4/3 | 1,929 | $2,488,000 | $2,600,000 | 104.5% | 11 | Apr 15 |
| 1010 Springfield Drive | Single Family | 5/4 | 2,025 | $2,398,000 | $2,552,000 | 106.4% | 9 | Apr 27 |
| 1459 Arroyo Seco Drive | Single Family | 5/3 | 2,311 | $2,398,900 | $2,375,000 | 99.0% | 18 | Apr 7 |
| 4730 Del Loma Court | Single Family | 4/2 | 1,322 | $1,999,000 | $2,299,000 | 115.0% | 8 | Apr 15 |
| 1172 Longfellow Avenue | Single Family | 4/3 | 1,505 | $2,249,888 | $2,249,888 | 100.0% | 21 | Apr 14 |
| 341 Dallas Drive | Single Family | 3/2 | 1,254 | $2,250,000 | $2,200,000 | 97.8% | 16 | Apr 17 |
| 2245 S San Tomas Aquino Road | Single Family | —/— | 2,410 | $2,250,000 | $2,165,000 | 96.2% | 23 | Apr 3 |
| 136 Lottie Lane | Townhouse | 4/3.5 | 2,100 | $1,998,000 | $2,150,000 | 107.6% | 6 | Apr 1 |
| 2310 Montezuma Drive | Single Family | 5/2 | 2,342 | $2,099,000 | $2,120,000 | 101.0% | 11 | Apr 22 |
| 466 Sam Cava Lane | Townhouse | 4/3.5 | 2,153 | $1,850,000 | $2,000,000 | 108.1% | 2 | Apr 13 |
| 963 Connie Drive | Single Family | 3/2 | 1,199 | $1,798,000 | $1,850,000 | 102.9% | 16 | Apr 6 |
| 244 Darryl Drive | Single Family | 4/2 | 1,785 | $1,799,000 | $1,800,000 | 100.1% | 3 | Apr 16 |
| 1155 Shamrock Drive | Single Family | 3/1 | 1,140 | $1,488,800 | $1,506,000 | 101.2% | 7 | Apr 3 |
| 162 Harrison Avenue | Single Family | 3/2.5 | 1,336 | $1,499,900 | $1,500,000 | 100.0% | 1 | Apr 30 |
| 75 Union Avenue #5 | Townhouse | 3/2.5 | 1,537 | $1,199,950 | $1,240,000 | 103.3% | 10 | Apr 2 |
| 135 Redding Road #A | Townhouse | 2/2.5 | 1,344 | $1,075,000 | $1,075,000 | 100.0% | 8 | Apr 27 |
| 137 Union Avenue #A | Condominium | 2/2 | 1,346 | $999,000 | $1,000,000 | 100.1% | 12 | Apr 10 |
| 3673 S Bascom Avenue | Townhouse | 2/2.5 | 1,392 | $895,000 | $885,000 | 98.9% | 45 | Apr 3 |
| 913 Apricot Avenue #B | Condominium | 2/2 | 1,187 | $798,000 | $780,000 | 97.7% | 20 | Apr 10 |
| 350 N 1St #Unit 3 | Condominium | 2/1 | 903 | $579,000 | $590,000 | 101.9% | 12 | Apr 24 |
The Numbers
| Metric | April 2026 |
|---|---|
| Total closings | 29 |
| Median sale price | $2,200,000 |
| Median price per sq ft | $1,123 |
| Median days on market | 11 |
| Closed over list | 18 of 29 |
| Closed under list | 7 of 29 |
| Median sale-to-list ratio | 101% |
What Sold
Single Family (21 sales)
The largest segment — 72% of the month's volume — saw homes trade from $1,500,000 to $4,200,000. The median landed at $2,552,000, with a median of $1,251 per square foot. Single-family homes moved fast: median days on market was 11, same as the overall figure, meaning the other types weren't dragging the pace down.
Townhouses (5 sales)
Five closed, ranging from $885,000 to $2,150,000. That spread is wide enough to mean almost anything — a smaller attached home near the low end and something closer to a detached-feel property near the top — but five sales isn't enough to generate a meaningful median, so the range is what it is.
Condominiums (3 sales)
Three condominiums recorded, from $590,000 to $1,000,000. Again, too few to report a median honestly. What it does show is that there's still a sub-$1M entry point in Campbell, and it comes in condo form.
What Moved the Median
The overall median came in at $2,200,000 and the per-square-foot median at $1,123. Single-family homes made up 72% of closings this month. That share was slightly higher than the prior month's 63%, but the arithmetic doesn't show that shift as the driver here — the mix change wasn't large enough to explain the median movement on its own.
What you're seeing is simply what Campbell homes sold for in April. The price-per-foot figure at $1,123 overall versus $1,251 for single-family alone reflects the natural drag from townhouses and condos trading at lower per-foot figures, not a distortion in what any one type was worth.
The One to Notice
1644 Castro Drive didn't just close over list — it closed 35.9% over list. Listed at $2,198,000, it sold for $2,988,000. That's $790,000 above asking. In a month where the median sale-to-list ratio was 101%, this one stood apart. The property isn't explained by the statistics alone, but the result is clear: multiple buyers competed hard enough to push the price nearly $800,000 past what the seller asked, and the winning bid carried the day at just under $3 million.
For context, that same month the month's top sale — 401 Dallas Drive — closed at $4,200,000 on 3,466 square feet, sitting on the market 15 days. And on the other end, 810 Virginia Court, listed at $4,070,000, closed at $3,850,000 — a 5.4% reduction from list, the only sale in the notable group that went the other direction.
Those three sales alone capture the texture of the month: a home that blew past its price, a home that commanded the highest dollar amount, and a home that required negotiation to find its buyer. All three happened in the same 30 days, in the same city.
All figures derived from recorded MLS closings for the period April 1–30, 2026.
Source: MLSListings closed sales in Campbell, April 2026. 29 closings. Sale prices and closing dates are matters of public record. A summary of recorded sales is not an appraisal and is not an opinion of value on any specific home.
Tim McMullen · DRE #02016832 · How these numbers are put together
Press kit: figures & citation for this report →
More Campbell market reports
Campbell Q3 2026 Market Report
Campbell Posts $112.4M in Q3 2026 — 61 Closings, One Sale at $5.7M, Median Lands at $1.785M
Campbell September 2026 Market Report
208 Kamson Way closed 45% over ask — but Campbell's September median landed at $1,768,000 across 23 sales
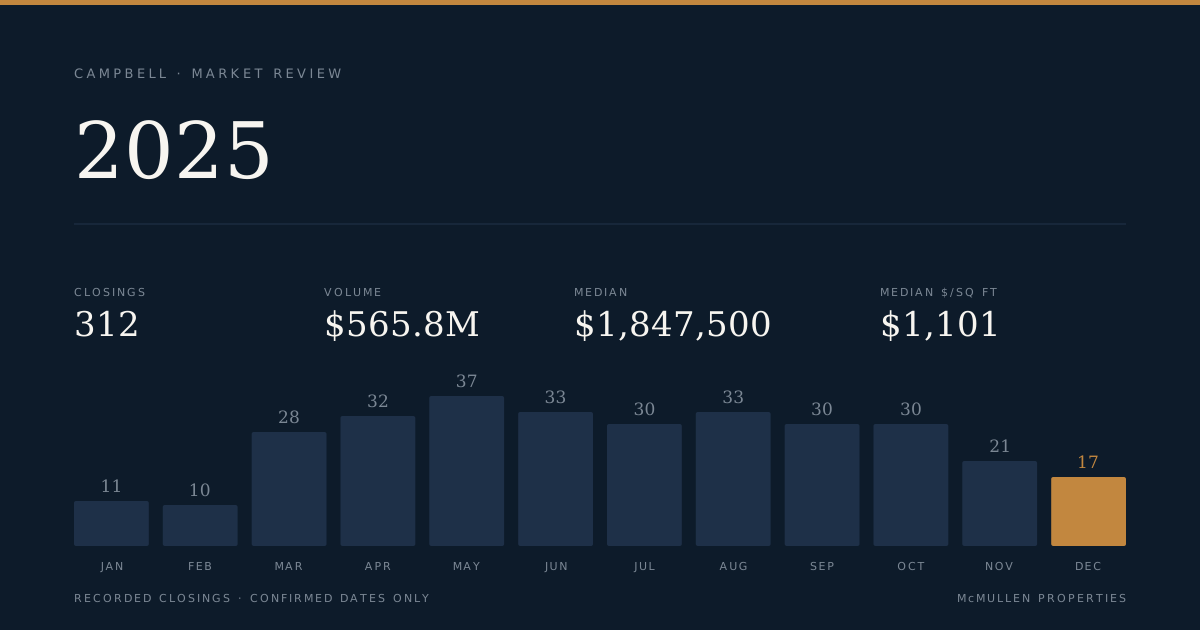
Campbell 2025 Market Report
Campbell Records 312 Closings and $565.8M in Volume for 2025, With a $1.45M Spread Between Segments