Campbell May 2026 Market Report
# May 2026 in Campbell: The mix changed, and the median followed
Single-family homes dropped from 72% of closings to 52%. That alone moved the overall median down — not the market.
The numbers
| Metric | May 2026 |
|---|---|
| Closings | 25 |
| Median sale price | $1,700,000 |
| Median price per sq ft | $973 |
| Median days on market | 11 |
| Sale-to-list ratio (median) | 102% |
| Closed over list | 14 of 25 |
| Closed under list | 6 of 25 |
What sold
Single-family homes carried the month, with 13 sales — but that 52% share is meaningfully lower than April's 72%. The 13 SFRs ranged from $1,499,000 to $3,310,101. Median sale: $1,938,000. Median price per square foot: $1,249. Median days on market: 11.
Condominiums produced 6 closings, spread from $427,000 to $935,000. That range is wide enough to tell you something about the variety — a nearly half-million-dollar spread inside one segment — but 6 sales is too few to report a median without overstating its meaning.
Townhouses also logged 6 sales, ranging from $920,000 to $2,100,000. Again, too few for a reliable median. The top end of that range is notable: $2.1 million for a townhouse puts it within reach of entry-level single-family money, and that spread from just under a million to just over two tells you these aren't interchangeable products.
What moved the median
The city-wide median of $1,700,000 is lower than it looks at first. This isn't a price story — it's a composition story, and an important one to get right.
When single-family homes made up 72% of closings, the overall median naturally sat near SFR prices. This month they were 52% of closings, and condos and townhouses — which trade at a significant discount — filled in more of the mix. That shift is large enough, arithmetically, that it moved the city-wide median on its own. The SFR median of $1,938,000 and the $973 city-wide price per square foot tell the same story differently: when you average in more sub-$1M product, the blended number moves down even if nothing changed in what individual homes are worth.
Don't read the city-wide number this month as a signal of softening. Read the segment medians instead — and read the condo and townhouse ranges for the texture the medians can't yet provide.
The one to notice
639 Hawthorne Avenue listed at $1,095,000 and closed at $1,505,000 — a 37.4% overbid, or $410,000 above asking. That is not a rounding error. It's not a pricing quirk. It's the kind of result that happens when a property hits exactly right and multiple buyers decide they want it badly enough to reach. The list price was presumably set to invite competition, but the gap between invite and outcome was remarkable even by Campbell standards. Whatever it was — the lot, the location within the neighborhood, the timing — fourteen other closings this month went over list, too. This one just went further than anyone else.
For contrast: 481 Dallas Drive listed at $1,799,998 and closed at $1,675,000, a 6.9% reduction. Some months produce both outcomes inside four weeks and three miles of each other. May was one of those months.
The top sale, 1596 Summerfield Drive, closed at $3,310,101 on day 6 — a 2,650-square-foot home that didn't linger. At that price point moving in less than a week, it's a reminder that the upper end of Campbell's single-family market has its own active buyers, even when the mix is pulling the city-wide number toward the middle.
Every recorded sale this month
All 25 closings, in order of price. Each address links to its full record.
| Address | Type | Bd/Ba | Sq ft | List | Sold | % of list | DOM | Closed |
|---|---|---|---|---|---|---|---|---|
| 1596 Summerfield Drive | Single Family | 5/3 | 2,650 | $2,998,000 | $3,310,101 | 110.4% | 6 | May 29 |
| 1270 Burrows Road | Single Family | 5/3 | 2,703 | $2,980,000 | $3,200,000 | 107.4% | 3 | May 26 |
| 56 Sunnyside Avenue | Single Family | 4/3.5 | 2,996 | $2,595,000 | $2,595,000 | 100.0% | 0 | May 19 |
| 185 Budd Avenue | Single Family | 3/2 | 2,030 | $2,298,000 | $2,500,000 | 108.8% | 11 | May 20 |
| 155 W Rosemary Lane | Single Family | 3/2 | 2,288 | $2,530,000 | $2,400,000 | 94.9% | 22 | May 29 |
| 1482 Ridgeley Drive | Single Family | 3/2 | 1,819 | $1,998,000 | $2,375,000 | 118.9% | 39 | May 28 |
| 616 Sunsweet Way | Townhouse | 4/3.5 | 2,159 | $1,998,000 | $2,100,000 | 105.1% | 3 | May 26 |
| 1010 Patricia Court | Single Family | 3/2 | 1,326 | $1,798,000 | $1,938,000 | 107.8% | 7 | May 27 |
| 1091 W Latimer Avenue | Single Family | 3/1.5 | 1,040 | $1,748,000 | $1,850,000 | 105.8% | 8 | May 19 |
| 2180 Vizcaya Circle | Townhouse | 3/3 | 2,421 | $1,749,999 | $1,835,000 | 104.9% | 6 | May 29 |
| 606 Allerton Loop | Townhouse | 3/3 | 1,729 | $1,598,000 | $1,700,000 | 106.4% | 6 | May 18 |
| 61 N Leigh Avenue | Single Family | 3/2 | 1,394 | $1,649,000 | $1,700,000 | 103.1% | 27 | May 5 |
| 1471 Inskip Drive | Single Family | 3/2 | 1,110 | $1,788,888 | $1,700,000 | 95.0% | 11 | May 11 |
| 481 Dallas Drive | Single Family | 3/2 | 1,272 | $1,799,998 | $1,675,000 | 93.1% | 23 | May 12 |
| 639 Hawthorne Avenue | Single Family | 3/1 | 984 | $1,095,000 | $1,505,000 | 137.4% | 6 | May 13 |
| 283 Esther Ave | Single Family | 3/3 | 1,540 | $1,530,000 | $1,499,000 | 98.0% | 63 | May 29 |
| 420 W Campbell Avenue | Townhouse | 3/2.5 | 2,065 | $1,388,888 | $1,410,000 | 101.5% | 9 | May 6 |
| 828 Rue Montagne | Townhouse | 2/2.5 | 1,295 | $988,000 | $1,037,000 | 105.0% | 11 | May 8 |
| 123 Dot Avenue | Condominium | 2/2.5 | 1,344 | $960,000 | $935,000 | 97.4% | 40 | May 4 |
| 833 S San Tomas Aquino Road #A | Townhouse | —/— | 1,467 | $920,000 | $920,000 | 100.0% | 14 | May 21 |
| 850 Apricot Avenue #A | Condominium | 2/2 | 1,065 | $825,000 | $825,000 | 100.0% | 0 | May 11 |
| 101 Redding Road #A4 | Condominium | 2/1.5 | 1,345 | $768,888 | $768,888 | 100.0% | 98 | May 28 |
| 970 Apricot Avenue | Condominium | 2/2 | 1,027 | $750,000 | $765,000 | 102.0% | 12 | May 1 |
| 351 N 1St Street #3 | Condominium | 2/1 | 810 | $580,000 | $580,000 | 100.0% | 0 | May 8 |
| 185 Union Avenue #89 | Condominium | 1/1 | 704 | $450,000 | $427,000 | 94.9% | 17 | May 28 |
Data reflects recorded MLS closings in Campbell for the period May 1–31, 2026.
Source: MLSListings closed sales in Campbell, May 2026. 25 closings. Sale prices and closing dates are matters of public record. A summary of recorded sales is not an appraisal and is not an opinion of value on any specific home.
Tim McMullen · DRE #02016832 · How these numbers are put together
Press kit: figures & citation for this report →
More Campbell market reports
Campbell Q3 2026 Market Report
Campbell Posts $112.4M in Q3 2026 — 61 Closings, One Sale at $5.7M, Median Lands at $1.785M
Campbell September 2026 Market Report
208 Kamson Way closed 45% over ask — but Campbell's September median landed at $1,768,000 across 23 sales
Campbell 2025 Market Report
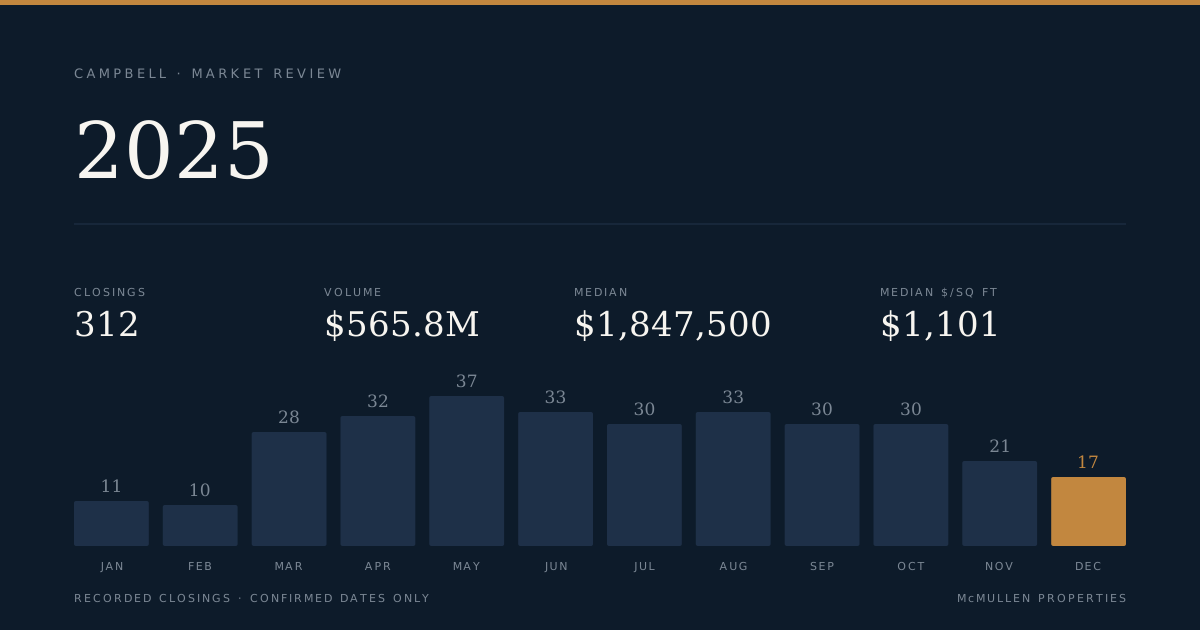
Campbell Records 312 Closings and $565.8M in Volume for 2025, With a $1.45M Spread Between Segments