Campbell July 2026 Market Report
# July 2026 in Campbell: Fifteen of 27 Closed Over List, and One Tiny House Sold for $3 Million
Twenty-seven closings. A median sale price of $2,100,000. A 888-square-foot house that changed hands for three million dollars. July was not a quiet month in Campbell.
The numbers
| Metric | July 2026 |
|---|---|
| Closings | 27 |
| Median sale price | $2,100,000 |
| Median price per sq ft | $1,207 |
| Median days on market | 19 |
| Sale-to-list ratio (median) | 100.4% |
| Closed over list | 15 of 27 |
| Closed under list | 10 of 27 |
What sold
Single family homes drove the month. Twenty of the 27 closings were detached houses — 74% of the volume. Their median came in at $2,407,500, with a median of 10 days on market and $1,246 per square foot. The range ran from $1,525,000 to $3,000,000.
Townhouses had four closings, from $938,000 to $1,828,610. Four sales isn't enough to report a median responsibly, so the range is what the data supports.
Condominiums had three closings, from $530,000 to $1,200,000. Same situation — range only.
The spread across all three segments is worth sitting with for a moment: $530,000 at the low end, $3,000,000 at the top. Campbell in July was not one market — it was several operating simultaneously.
What moved the median
The overall median of $2,100,000 reflects the prices at which Campbell homes actually closed this month. Single-family homes made up 74% of closings, up 7 percentage points from the prior month, but the arithmetic doesn't pin the median movement on that shift — the mix change simply wasn't large enough to be the explanation. These were the prices. That's the record.
What the over/under-list split does tell you: 15 homes closed above asking, 10 closed below, and 2 landed exactly at list. The median sale-to-list of 100.4% describes a market where the two sides are roughly offsetting each other in aggregate — but that aggregate conceals 2089 Orestes Way going for 29.3% over its list price and 1049 Lucot Way closing 9.3% below its own. The spread between those two outcomes is the real texture of July.
The one to notice
1422 York Avenue closed at $3,000,000 on July 3 — three days on market, 888 square feet. That works out to roughly $3,378 per square foot, more than 2.5 times the month's overall median of $1,207. Nothing in the block explains why — the data doesn't give us lot size, condition, or location within Campbell, and it's not this column's job to speculate. What the record shows is that someone paid three million dollars for a home smaller than many two-bedroom apartments, and they did it in seventy-two hours. Whether that reflects an exceptional lot, a teardown premium, or something else entirely, the number stands on its own. It's the kind of transaction that makes you look twice at the address to make sure you read it right. Three million. 888 square feet. Three days.
For contrast: 2089 Orestes Way listed at $1,895,000 and closed at $2,450,000 — $555,000 over asking, a 29.3% premium. And 1049 Lucot Way listed at $2,298,000 and sold for $2,085,000, a $213,000 reduction. Both are July 2026 Campbell. Both are real. The same month that produced the biggest overbid also produced the deepest cut, and neither outcome was at the extremes of the price range. That's the honest shape of this market right now.
Every recorded sale this month
All 27 closings, in order of price. Each address links to its full record.
| Address | Type | Bd/Ba | Sq ft | List | Sold | % of list | DOM | Closed |
|---|---|---|---|---|---|---|---|---|
| 1422 York Avenue | Single Family | 2/1 | 888 | $2,999,000 | $3,000,000 | 100.0% | 3 | Jul 23 |
| 4036 Lemoyne Way | Single Family | 4/2 | 1,718 | $2,398,000 | $2,750,000 | 114.7% | 11 | Jul 20 |
| 368 Hatcher Court | Single Family | 5/3.5 | 2,700 | $2,880,000 | $2,750,000 | 95.5% | 14 | Jul 10 |
| 1300 Patio Dr | Single Family | 3/2.5 | 2,076 | $2,575,000 | $2,700,000 | 104.9% | 6 | Jul 29 |
| 2465 Fenian Drive | Single Family | 4/2.5 | 2,544 | $2,650,000 | $2,625,000 | 99.1% | 64 | Jul 10 |
| 1631 Fawn Court | Single Family | 4/2 | 1,520 | $2,488,000 | $2,600,000 | 104.5% | 14 | Jul 30 |
| 60 N Milton Avenue | Single Family | 4/3 | 2,006 | $2,495,000 | $2,516,000 | 100.8% | 8 | Jul 23 |
| 2089 Orestes Way | Single Family | 4/3 | 1,992 | $1,895,000 | $2,450,000 | 129.3% | 9 | Jul 22 |
| 1676 Ebbetts Drive | Single Family | 3/2 | 1,651 | $2,288,000 | $2,450,000 | 107.1% | 7 | Jul 1 |
| 1195 Steinway Avenue | Single Family | 3/2 | 1,631 | $2,399,000 | $2,415,000 | 100.7% | 7 | Jul 10 |
| 164 N 3Rd Street | Single Family | 3/2 | 1,833 | $1,980,000 | $2,400,000 | 121.2% | 3 | Jul 20 |
| 1305 Walnut Drive | Single Family | 2/1 | 1,854 | $2,350,000 | $2,291,000 | 97.5% | 46 | Jul 31 |
| 4080 Keith Drive | Single Family | 4/2 | 1,836 | $2,149,000 | $2,200,000 | 102.4% | 52 | Jul 10 |
| 28 N Peter Drive | Single Family | 3/2.5 | 1,697 | $1,998,000 | $2,100,000 | 105.1% | 6 | Jul 20 |
| 1049 Lucot Way | Single Family | 3/2 | 1,520 | $2,298,000 | $2,085,000 | 90.7% | 31 | Jul 17 |
| 189 Sunnyside Avenue | Single Family | 4/3.5 | 2,020 | $2,198,000 | $2,000,000 | 91.0% | 19 | Jul 14 |
| 3813 Ainsley Court | Single Family | 4/2 | 1,711 | $2,049,888 | $1,971,000 | 96.2% | 36 | Jul 30 |
| 399 Castro Court | Single Family | 3/2 | 1,248 | $1,898,000 | $1,950,000 | 102.7% | 8 | Jul 2 |
| 1055 Mitchell Court | Single Family | 4/2 | 1,533 | $1,898,000 | $1,850,000 | 97.5% | 42 | Jul 9 |
| 271 Wagon Way #38-03 - Plan 4 | Townhouse | —/— | 2,094 | $1,821,060 | $1,828,610 | 100.4% | 57 | Jul 10 |
| 124 Lottie Lane | Townhouse | 4/3.5 | 2,100 | $1,800,000 | $1,800,000 | 100.0% | 66 | Jul 24 |
| 81 S Milton Avenue | Single Family | 3/1 | 1,364 | $1,525,000 | $1,525,000 | 100.0% | 0 | Jul 31 |
| 267 Wagon Way #40-03 - Plan 1 | Townhouse | —/— | 1,435 | $1,333,581 | $1,308,931 | 98.2% | 101 | Jul 27 |
| 912 Campisi Way #417 | Condominium | 3/2 | 1,807 | $1,300,000 | $1,200,000 | 92.3% | 232 | Jul 17 |
| 607 Millich Drive | Townhouse | 3/2.5 | 1,242 | $898,000 | $938,000 | 104.5% | 38 | Jul 24 |
| 905 Apricot Avenue #G | Condominium | 2/2 | 1,187 | $800,000 | $780,000 | 97.5% | 36 | Jul 28 |
| 3595 S Bascom Avenue #27 | Condominium | 1/1 | 742 | $525,000 | $530,000 | 101.0% | 21 | Jul 30 |
---
Data sourced from recorded MLS closings, July 1–31, 2026. Coverage through August 12, 2026. 42 closings with estimated dates excluded from this analysis.
Source: MLSListings closed sales in Campbell, July 2026. 27 closings; 42 further sales are excluded because their closing date could not be confirmed. Sale prices and closing dates are matters of public record. A summary of recorded sales is not an appraisal and is not an opinion of value on any specific home.
Tim McMullen · DRE #02016832 · How these numbers are put together
Press kit: figures & citation for this report →
More Campbell market reports
Campbell Q3 2026 Market Report
Campbell Posts $112.4M in Q3 2026 — 61 Closings, One Sale at $5.7M, Median Lands at $1.785M
Campbell September 2026 Market Report
208 Kamson Way closed 45% over ask — but Campbell's September median landed at $1,768,000 across 23 sales
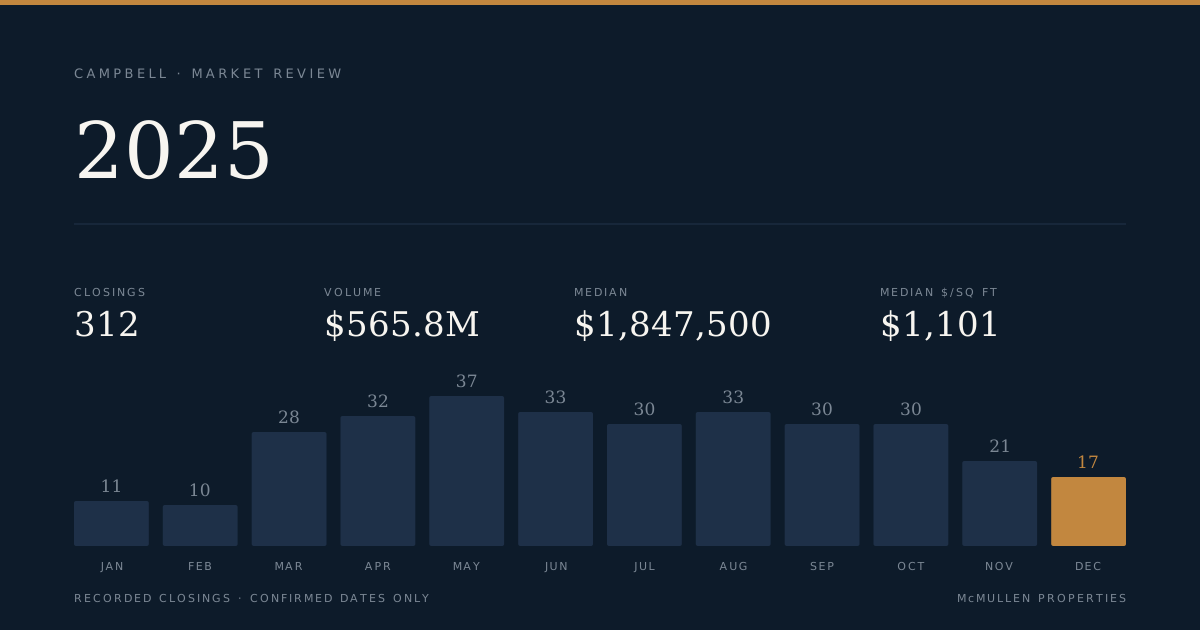
Campbell 2025 Market Report
Campbell Records 312 Closings and $565.8M in Volume for 2025, With a $1.45M Spread Between Segments